I looked at this on daily and did not see anything except a recent bear flags.
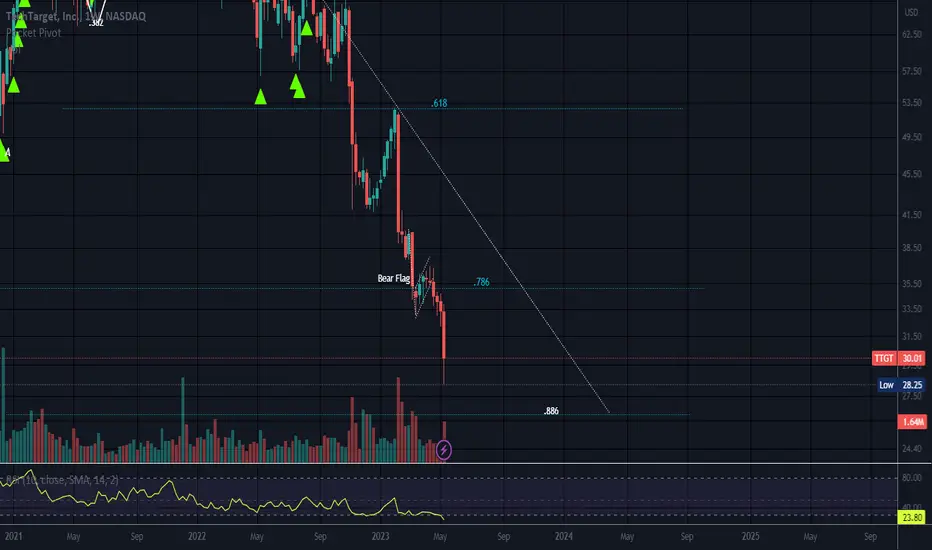
I switched it to the weekly timeframe and I see an M with peak 2 higher than peak 1 so possible Shark. This took a nose dive past the .786 so is not a Cypher.
Sharks terminate at the .886 or the 1.113 on the 4th leg (1.113 would be significantly under $10)
This stock is not receiving any love in this environment but I keep it on my watch list. Some try to pick 10, 20 or even more to watch so they are not overwhelmed b looking at a 100 different stocks. I come to know how the ones on my list perform and I trade them over and over again. This one is on my list even though it may be somewhere over the rainbow before I buy it again. I still check on it here and there.
No recommendation.
Exención de responsabilidad
La información y las publicaciones que ofrecemos, no implican ni constituyen un asesoramiento financiero, ni de inversión, trading o cualquier otro tipo de consejo o recomendación emitida o respaldada por TradingView. Puede obtener información adicional en las Condiciones de uso.