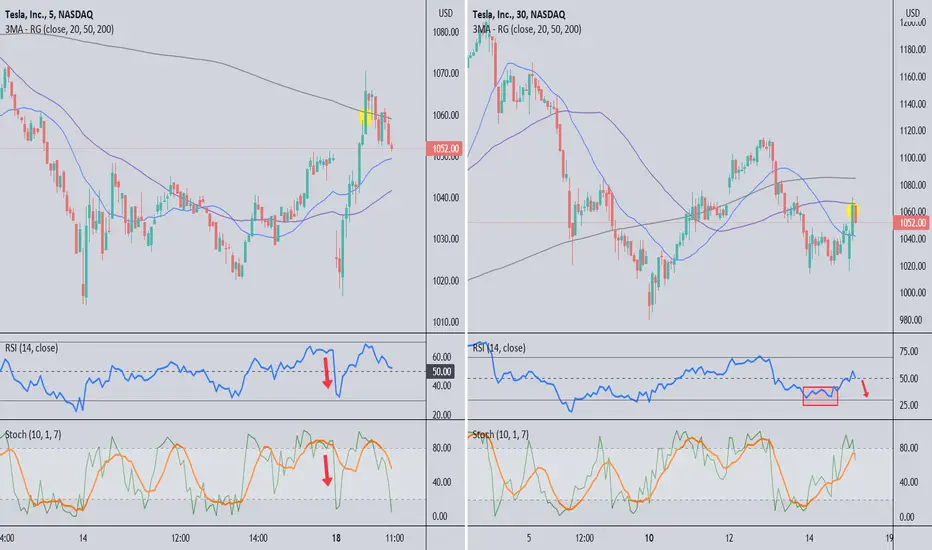
This is another day trade made in context of the daily chart I posted recently (linked). TSLA daily chart is neutral but the markets are bearish, and so are the 5 and 30 minute TSLA charts, shown here. On the 30m chart, the 20MA is under the 50MA and 200MA. Red markers shows RSI and Stochastic gave bearish warnings and there resistance is around 1060 on both timeframes. This makes for a stronger trade setup.
The yellow circles mark put entry (where and when I bought puts). In this example I bought weekly 960 puts and did not expect price to push as high as 1068. However with only a few contracts I was willing to hold for a reversal, or I will take a loss. When volatile stocks like TSLA see rapid price movement the IV rises also, so my put prices did not drop too much.
As I publish this, price fought at resistance and looks like it may move lower. So I will give this a little more time and see if the trade starts working. If Nasdaq starts losing more then TSLA should start dropping with it.
Nota
Bought 2 puts of 18Feb 700 strike, based on weekly and daily charts, to hold through earnings. If TSLA goes up after earnings I will lose big in percent, but my real capital loss will be less than 800usd.Publicaciones relacionadas
Exención de responsabilidad
La información y las publicaciones que ofrecemos, no implican ni constituyen un asesoramiento financiero, ni de inversión, trading o cualquier otro tipo de consejo o recomendación emitida o respaldada por TradingView. Puede obtener información adicional en las Condiciones de uso.
Publicaciones relacionadas
Exención de responsabilidad
La información y las publicaciones que ofrecemos, no implican ni constituyen un asesoramiento financiero, ni de inversión, trading o cualquier otro tipo de consejo o recomendación emitida o respaldada por TradingView. Puede obtener información adicional en las Condiciones de uso.