Toast Inc. is a cloud-based platform providing restaurant management software, including POS systems, payments, and operations tools. It's a growth stock in fintech/SaaS, benefiting from restaurant digitization but volatile with economic sensitivity to hospitality spending.
Recent Performance & Fundamentals:
Current Price: $34.98 (as of Oct 10, 2025 close, down 5.10% on the day with 6.88% intraday fluctuation).
Market Cap: $18.8B.
52-Week Range: ~$20–$60 (trading mid-range after YTD volatility).
Key Metrics: Trailing P/E 92.64, EPS (TTM) $0.39 (up 223% YoY on strong growth). Forward P/E 29.85; Q3 earnings due Nov 6.
News/Outlook: Recent survey highlights industry adoption, but shares dipped on broader market rotation; EPS growth and revenue ramps support 2025 optimism.
Buy, Hold, or Sell?
Strong Buy. Analyst consensus is Overweight/Buy (29 ratings), with average price target $50.30 (~44% upside from here), high $60, low $36. Ideal entry on dip for growth portfolios, but watch consumer spending.
Technical Areas to Watch:
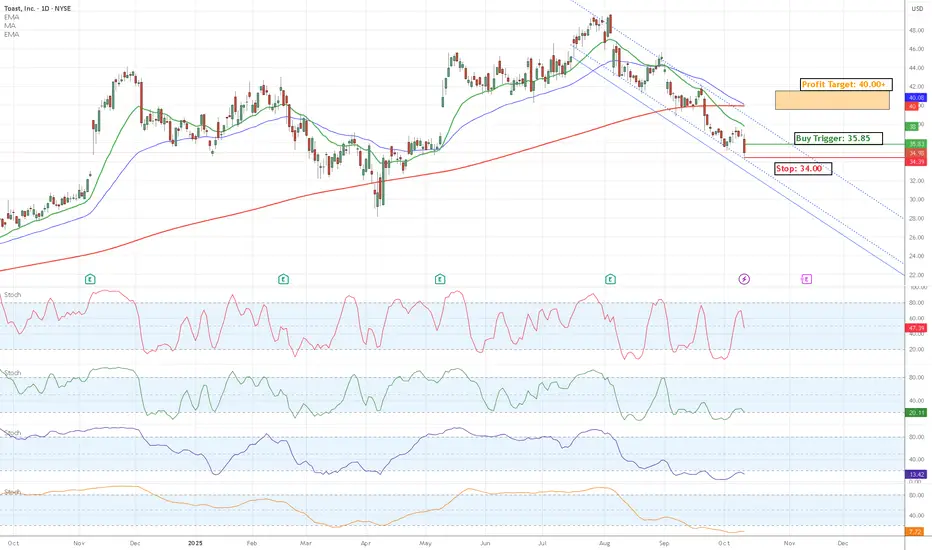
Short-term bearish/oversold (overall Sell signal), potential rebound setup. Key levels:
Support: $34.00 (recent low; break eyes $30 psychological).
Resistance: $36.00 (prior close; clear for $40 50-day MA).
Key Indicators:
RSI (14): 30.41 (oversold—watch bounce >40).
MACD: -0.29 (bearish, but divergence possible).
MAs: Below 200-day ~$39.91 (Sell); volume up on dip.
Recent Performance & Fundamentals:
Current Price: $34.98 (as of Oct 10, 2025 close, down 5.10% on the day with 6.88% intraday fluctuation).
Market Cap: $18.8B.
52-Week Range: ~$20–$60 (trading mid-range after YTD volatility).
Key Metrics: Trailing P/E 92.64, EPS (TTM) $0.39 (up 223% YoY on strong growth). Forward P/E 29.85; Q3 earnings due Nov 6.
News/Outlook: Recent survey highlights industry adoption, but shares dipped on broader market rotation; EPS growth and revenue ramps support 2025 optimism.
Buy, Hold, or Sell?
Strong Buy. Analyst consensus is Overweight/Buy (29 ratings), with average price target $50.30 (~44% upside from here), high $60, low $36. Ideal entry on dip for growth portfolios, but watch consumer spending.
Technical Areas to Watch:
Short-term bearish/oversold (overall Sell signal), potential rebound setup. Key levels:
Support: $34.00 (recent low; break eyes $30 psychological).
Resistance: $36.00 (prior close; clear for $40 50-day MA).
Key Indicators:
RSI (14): 30.41 (oversold—watch bounce >40).
MACD: -0.29 (bearish, but divergence possible).
MAs: Below 200-day ~$39.91 (Sell); volume up on dip.
Exención de responsabilidad
La información y las publicaciones no constituyen, ni deben considerarse como asesoramiento o recomendaciones financieras, de inversión, de trading o de otro tipo proporcionadas o respaldadas por TradingView. Más información en Condiciones de uso.
Exención de responsabilidad
La información y las publicaciones no constituyen, ni deben considerarse como asesoramiento o recomendaciones financieras, de inversión, de trading o de otro tipo proporcionadas o respaldadas por TradingView. Más información en Condiciones de uso.