TITAN COMPANY LTD (NSE:TITAN) - High Probability Reversal Setup
Weekly Timeframe Analysis | Potential Swing Trade Opportunity
▲ BULLISH CASE[/color]
Elliott Wave Structure:
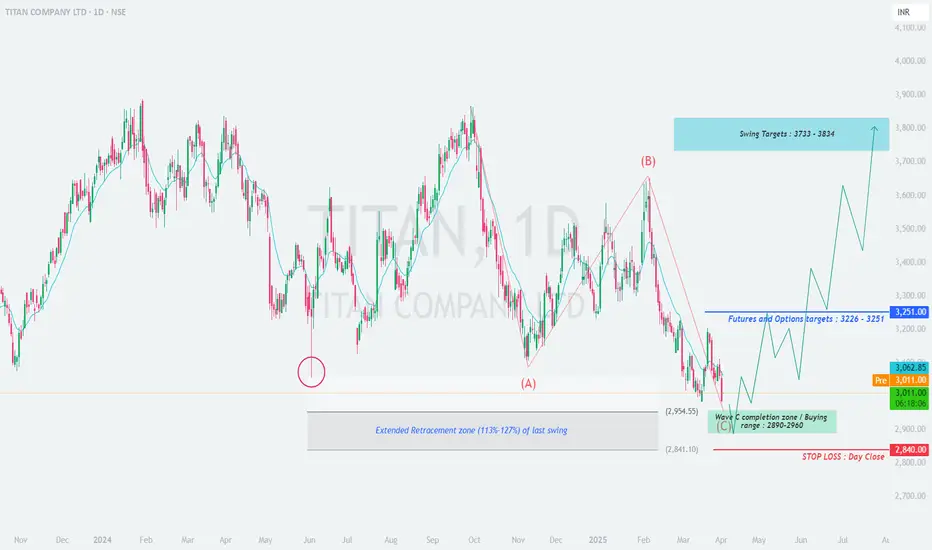
• Appears to be completing Wave C of correction (ABC pattern)
• Wave C = 1.272 extension of Wave A at ₹2,890-2,960 zone
• Typical reversal area for such corrections
Technical Confluences:
• [u]Fibonacci Support:[/u]
1.127-1.272 retracement of prior uptrend
Aligns with 2023 swing high area
• [u]Volume Profile:[/u]
High volume node at ₹2,920
Declining volume on recent downmove
Pattern Recognition:
• Potential falling wedge (bullish)
• RSI(14) weekly showing bullish divergence
• MACD histogram flattening near lows
▼ RISK FACTORS[/color]
• Breakdown below ₹2,840 invalidates setup
• Broader market weakness could delay recovery
• FIIs reducing positions in consumer sector
📊 Trade Plan
📌 Key Levels
[table]
[tr]
[td]Support[/td]
[td]Resistance[/td]
[/tr]
[tr]
[td]₹2,960 (immediate)[/td]
[td]₹3,100 (200 DMA)[/td]
[/tr]
[tr]
[td]₹2,890 (strong)[/td]
[td]₹3,226 (F&O OI peak)[/td]
[/tr]
[tr]
[td]₹2,840 (absolute)[/td]
[td]₹3,733 (ATH)[/td]
[/tr]
[/table]
💡 Additional Notes:
• Watch for bullish reversal candle patterns in the zone
• FII derivative data shows put writing at ₹2,900 strike
• Consumer sector showing relative strength vs Nifty
Would you take this trade? Discuss in comments!
#TITAN,#NSE,#swingtrading,#elliottwave,#technicalanalysis
Weekly Timeframe Analysis | Potential Swing Trade Opportunity
▲ BULLISH CASE[/color]
Elliott Wave Structure:
• Appears to be completing Wave C of correction (ABC pattern)
• Wave C = 1.272 extension of Wave A at ₹2,890-2,960 zone
• Typical reversal area for such corrections
Technical Confluences:
• [u]Fibonacci Support:[/u]
1.127-1.272 retracement of prior uptrend
Aligns with 2023 swing high area
• [u]Volume Profile:[/u]
High volume node at ₹2,920
Declining volume on recent downmove
Pattern Recognition:
• Potential falling wedge (bullish)
• RSI(14) weekly showing bullish divergence
• MACD histogram flattening near lows
▼ RISK FACTORS[/color]
• Breakdown below ₹2,840 invalidates setup
• Broader market weakness could delay recovery
• FIIs reducing positions in consumer sector
📊 Trade Plan
- []Entry Zone: ₹2,890-2,960 (scale-in approach recommended)
[]Stop Loss: Daily close below ₹2,840 (absolute) - Targets:
T1: ₹3,226 (61.8% retrace)
T2: ₹3,733 (previous high)
T3: ₹3,834 (127% extension) - Timeframe: 8-12 week hold for full targets
📌 Key Levels
[table]
[tr]
[td]Support[/td]
[td]Resistance[/td]
[/tr]
[tr]
[td]₹2,960 (immediate)[/td]
[td]₹3,100 (200 DMA)[/td]
[/tr]
[tr]
[td]₹2,890 (strong)[/td]
[td]₹3,226 (F&O OI peak)[/td]
[/tr]
[tr]
[td]₹2,840 (absolute)[/td]
[td]₹3,733 (ATH)[/td]
[/tr]
[/table]
💡 Additional Notes:
• Watch for bullish reversal candle patterns in the zone
• FII derivative data shows put writing at ₹2,900 strike
• Consumer sector showing relative strength vs Nifty
Would you take this trade? Discuss in comments!
#TITAN,#NSE,#swingtrading,#elliottwave,#technicalanalysis
Operación activa
Trading near Swing Target, predicted at perfect bottomOperación cerrada: objetivo alcanzado
Well predicted bottom and reaching at target nowExención de responsabilidad
La información y las publicaciones que ofrecemos, no implican ni constituyen un asesoramiento financiero, ni de inversión, trading o cualquier otro tipo de consejo o recomendación emitida o respaldada por TradingView. Puede obtener información adicional en las Condiciones de uso.
Exención de responsabilidad
La información y las publicaciones que ofrecemos, no implican ni constituyen un asesoramiento financiero, ni de inversión, trading o cualquier otro tipo de consejo o recomendación emitida o respaldada por TradingView. Puede obtener información adicional en las Condiciones de uso.