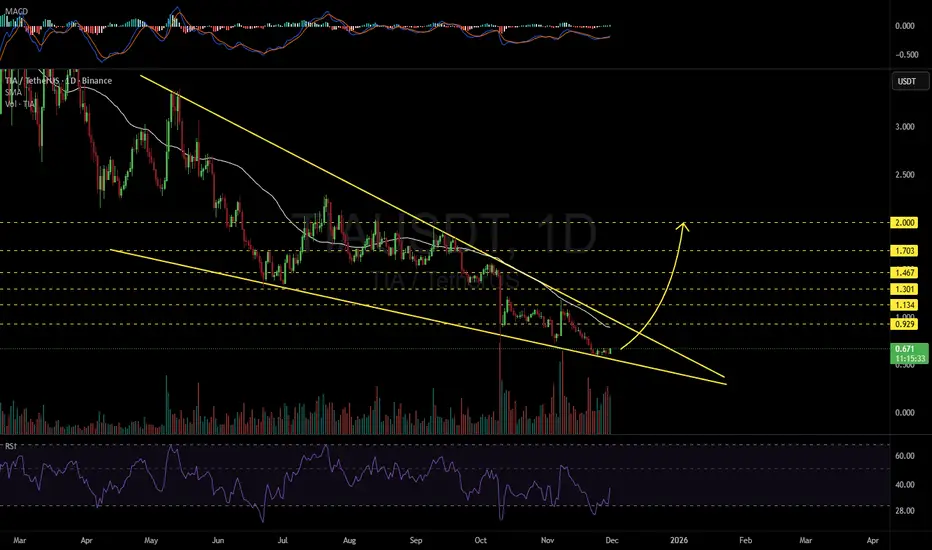
#TIA may be aiming for the $2 level.
#TIA is moving inside a falling wedge pattern on the daily chart and has bounced off the wedge support. In case of a breakout above the wedge resistance and the daily SMA50, the targets are:
🎯 $0.929
🎯 $1.134
🎯 $1.301
🎯 $1.467
🎯 $1.703
🎯 $2.000
⚠️ Always remember to use a tight stop-loss and maintain proper risk management.
Exención de responsabilidad
La información y las publicaciones no constituyen, ni deben considerarse como asesoramiento o recomendaciones financieras, de inversión, de trading o de otro tipo proporcionadas o respaldadas por TradingView. Más información en Condiciones de uso.
Exención de responsabilidad
La información y las publicaciones no constituyen, ni deben considerarse como asesoramiento o recomendaciones financieras, de inversión, de trading o de otro tipo proporcionadas o respaldadas por TradingView. Más información en Condiciones de uso.