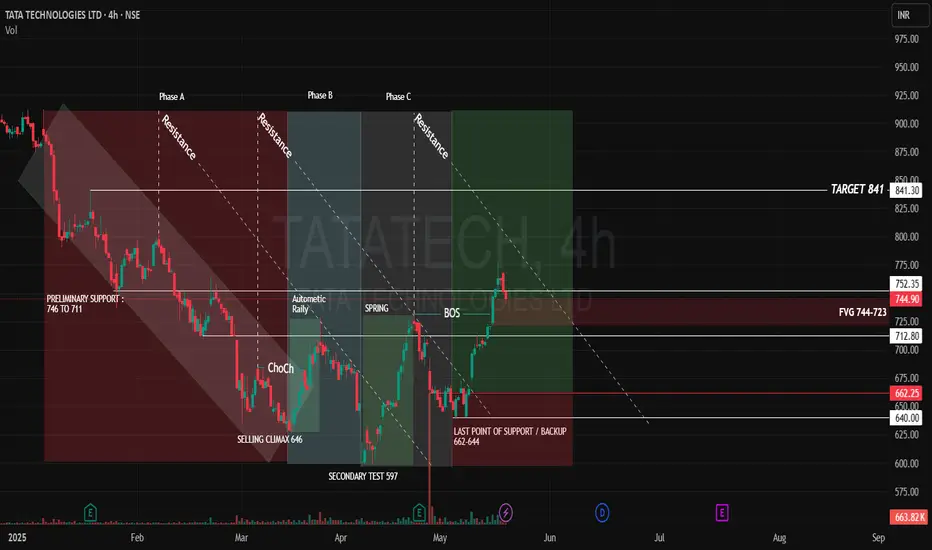
- Tata Technologies has shown a strong upward move from the Last Point of Support (LPS) near 640, in alignment with the Wyckoff Method. The price rallied up to 778, indicating strong bullish momentum.
- The trend structure reveals Higher Highs (HH) and Higher Lows (HL), confirming a bullish market structure. A Bullish Fair Value Gap (FVG) has been identified between 723 and 744, which could offer a second entry opportunity if price revisits and mitigates this zone.
- The downward resistance trendline, now plotted, may act as a key resistance zone. A breakout above this trendline would further confirm bullish strength.
- The Break of Structure (BOS) around 731 supports the projection of a continued move toward the target of 841. Additionally, the Preliminary Support zone (746–711)—previously a base for accumulation—may now act as a strong resistance-turned-support zone upon a successful breakout.
Trade Projection - Partial Entry: Around CMP (757)
- Final Entry Zone: If price revisits and mitigates the FVG at 723–744
- Target: 841
- Bullish Continuation: Look for future Bullish FVGs as signs of sustained momentum
Bearish Scenario – Selling Opportunity
If the FVG fails to hold and price breaks below 712, it would indicate a Change of Character (ChoCH) and invalidate the bullish setup. In that case, we could expect a decline toward the next support zone at 662.
Zones & Levels - FVG (Fair Value Gap): 744–723
- Target: 841.30
- Support Levels:
- 712.80
- 662.25
- 640.00
Disclaimer:lnkd.in/gJJDnvn2
Exención de responsabilidad
La información y las publicaciones que ofrecemos, no implican ni constituyen un asesoramiento financiero, ni de inversión, trading o cualquier otro tipo de consejo o recomendación emitida o respaldada por TradingView. Puede obtener información adicional en las Condiciones de uso.