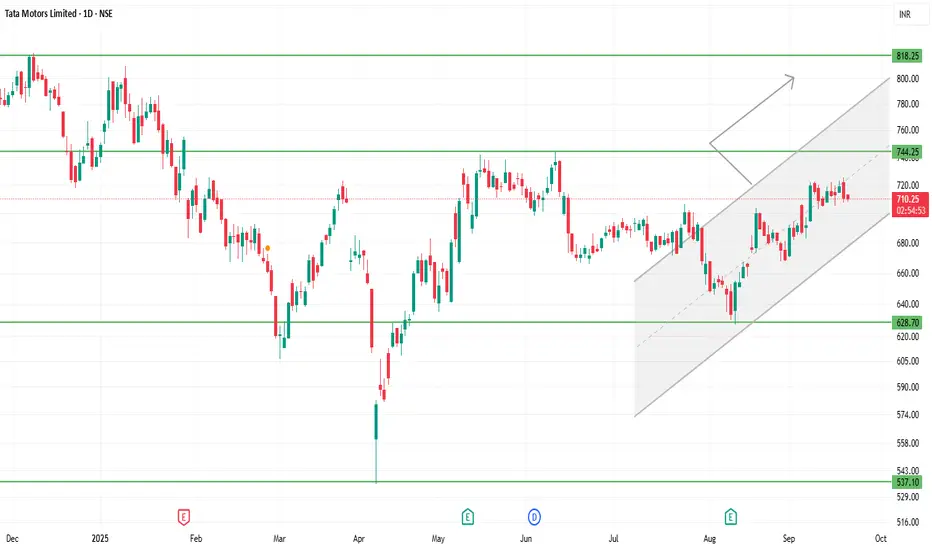
Tata Motors is trading around ₹710-₹720 (give or take).
The 52-week high is roughly ₹1,000+, and the 52-week low is approx ₹535-₹550.
There is visible investor concern: production halts (especially in JLR, its luxury arm) and demand pressures are weighing.
Recent performance is mixed; some short-term strength, but many indicators suggest resistance and caution.
⚙️ Technical / Trend Insights
The trend shows a mildly bullish bias in the short-term: price action is forming higher lows (e.g. holding above ₹700-705) which suggests buyers are defending downside.
Resistance zones are limiting gains: repeated attempts to push above ~₹720-725 have met selling.
Momentum indicators (RSI, MACD etc.) are positive but not deeply overbought — there’s room, but risk of pullbacks if resistance holds.
There are hints of bullish chart patterns (for example, ascending structures or potential reversal formations) if price manages to cross certain resistance levels.
⚠️ Risks / Things That Could Go Wrong
If it breaks down below ₹700-705, risk increases toward lower support in the ₹686-₹700 band.
Failure to break above ₹720-₹725 with decent volume could lead to sideways trading or minor corrections.
Macro / sectoral headwinds — demand issues, international business (JLR), cost pressures — could press down on fundamentals.
Publicaciones relacionadas
Exención de responsabilidad
La información y las publicaciones que ofrecemos, no implican ni constituyen un asesoramiento financiero, ni de inversión, trading o cualquier otro tipo de consejo o recomendación emitida o respaldada por TradingView. Puede obtener información adicional en las Condiciones de uso.