📊 Weekly Support & Resistance – Current Levels
Resistance Levels (Upside Targets)
R1: ~₹1,182 – first weekly resistance zone.
R2: ~₹1,200 – medium resistance.
R3: ~₹1,212–₹1,218 – higher resistance cluster.
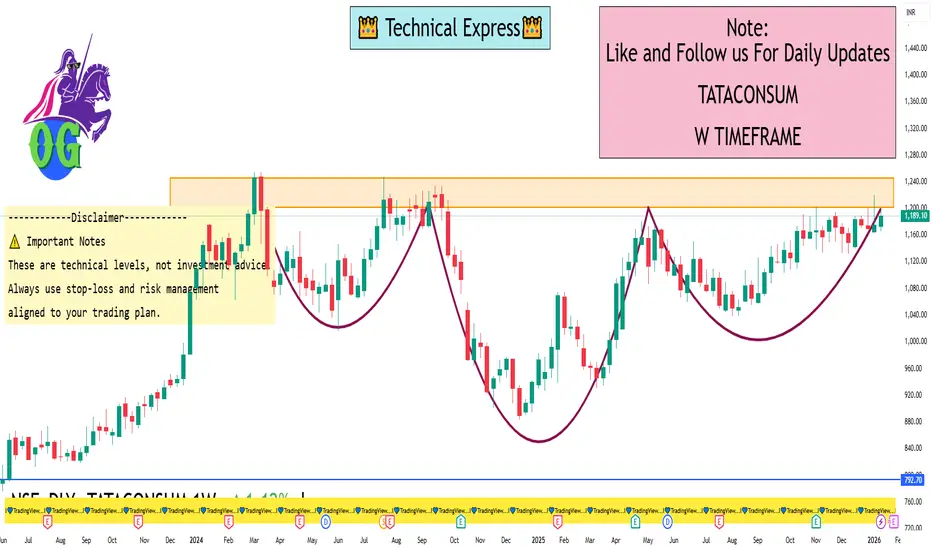
Major weekly zone: ~₹1,243–₹1,265 – extended upside possible if breakout happens.
Support Levels (Downside Levels)
S1: ~₹1,152–₹1,153 – primary weekly support.
S2: ~₹1,131 – next support zone.
S3: ~₹1,097 – deeper support if S2 breaks.
Lower supports: ~₹1,136–₹1,151 cluster from other pivots.
📌 Weekly Pivot Reference (Live-ish)
Current price is around ₹1,185–₹1,190 region, indicating the balance zone for the week.
📈 How to Use These Levels This Week
Bullish Scenario
A sustained move above ₹1,200 → could accelerate toward ₹1,212–₹1,218 and then ₹1,243+.
Hold above ₹1,182 keeps near-term upside intact.
Bearish Scenario
A break below ₹1,152 → could see correction down to ₹1,131 & ₹1,097.
Weekly close below ₹1,131 may signal deeper selling.
Neutral/Range
If price stays between ₹1,152–₹1,200 → we could see consolidation before a breakout direction.
🧠 Additional Current Indicators (Context)
RSI & SMA readings on daily suggest neutral to mixed momentum, not extreme overbought/oversold.
Moving averages around 1,180–1,171 zones give overlapping support confluence.
⚠️ Important Notes
These are technical levels, not investment advice.
Weekly levels are based on recent technical support/resistance analysis — actual prices may vary intra-session.
Always use stop-loss and risk management aligned to your trading plan.
Resistance Levels (Upside Targets)
R1: ~₹1,182 – first weekly resistance zone.
R2: ~₹1,200 – medium resistance.
R3: ~₹1,212–₹1,218 – higher resistance cluster.
Major weekly zone: ~₹1,243–₹1,265 – extended upside possible if breakout happens.
Support Levels (Downside Levels)
S1: ~₹1,152–₹1,153 – primary weekly support.
S2: ~₹1,131 – next support zone.
S3: ~₹1,097 – deeper support if S2 breaks.
Lower supports: ~₹1,136–₹1,151 cluster from other pivots.
📌 Weekly Pivot Reference (Live-ish)
Current price is around ₹1,185–₹1,190 region, indicating the balance zone for the week.
📈 How to Use These Levels This Week
Bullish Scenario
A sustained move above ₹1,200 → could accelerate toward ₹1,212–₹1,218 and then ₹1,243+.
Hold above ₹1,182 keeps near-term upside intact.
Bearish Scenario
A break below ₹1,152 → could see correction down to ₹1,131 & ₹1,097.
Weekly close below ₹1,131 may signal deeper selling.
Neutral/Range
If price stays between ₹1,152–₹1,200 → we could see consolidation before a breakout direction.
🧠 Additional Current Indicators (Context)
RSI & SMA readings on daily suggest neutral to mixed momentum, not extreme overbought/oversold.
Moving averages around 1,180–1,171 zones give overlapping support confluence.
⚠️ Important Notes
These are technical levels, not investment advice.
Weekly levels are based on recent technical support/resistance analysis — actual prices may vary intra-session.
Always use stop-loss and risk management aligned to your trading plan.
I built a Buy & Sell Signal Indicator with 85% accuracy.
📈 Get access via DM or
WhatsApp: wa.link/d997q0
Contact - +91 76782 40962
| Email: techncialexpress@gmail.com
| Script Coder | Trader | Investor | From India
📈 Get access via DM or
WhatsApp: wa.link/d997q0
Contact - +91 76782 40962
| Email: techncialexpress@gmail.com
| Script Coder | Trader | Investor | From India
Publicaciones relacionadas
Exención de responsabilidad
La información y las publicaciones no constituyen, ni deben considerarse como asesoramiento o recomendaciones financieras, de inversión, de trading o de otro tipo proporcionadas o respaldadas por TradingView. Más información en Condiciones de uso.