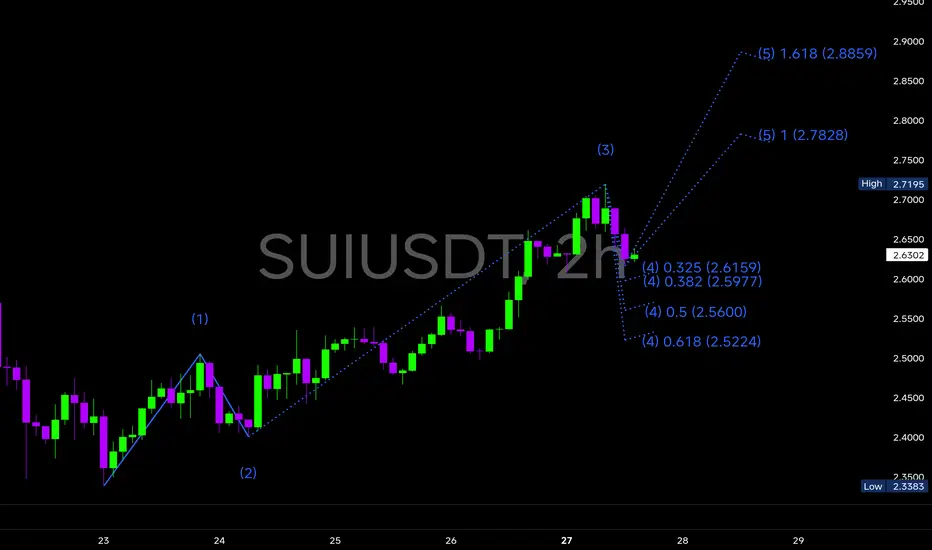
🔹We’re currently in Wave 4 correction after completing an impulsive Wave 3 rally that peaked around 2.71.
🔸Wave 4 retracement appears to be stabilizing between the 0.382 (2.59) and 0.5 (2.56) Fibonacci zones — a healthy correction zone before the next push.
🔹If the structure holds, Wave 5 could extend to 2.78 (1.0 Fib) and 2.89 (1.618 Fib), aligning perfectly with our previous resistance at 2.9–3.0.
This continuation pattern signals that bulls are still in control, consolidating before another potential breakout.
💡 Key Technical Levels
Support zones: 2.56 / 2.48
Resistance zones: 2.78 / 2.89 / 3.01
Short-term bias: Bullish
Trend structure: Higher highs and higher lows forming — early signs of trend continuation.
If price holds above 2.55–2.60, the rally could extend toward 2.89–3.00, where both Elliott projection and MA200 converge.
However, if 2.48 breaks down, we may see a temporary pullback before resuming bullish structure.
Volume confirmation will be key — once momentum spikes, this could be the final impulsive leg of the short-term uptrend.
Exención de responsabilidad
La información y las publicaciones que ofrecemos, no implican ni constituyen un asesoramiento financiero, ni de inversión, trading o cualquier otro tipo de consejo o recomendación emitida o respaldada por TradingView. Puede obtener información adicional en las Condiciones de uso.