A trendline breakdown occurs when the price of an asset falls below a trendline, signaling a potential reversal or shift in market momentum. Here’s how it works, explained concisely:
1. **Trendline Definition**: A trendline is a diagonal line drawn on a price chart connecting higher lows in an uptrend or lower highs in a downtrend, indicating support or resistance levels.
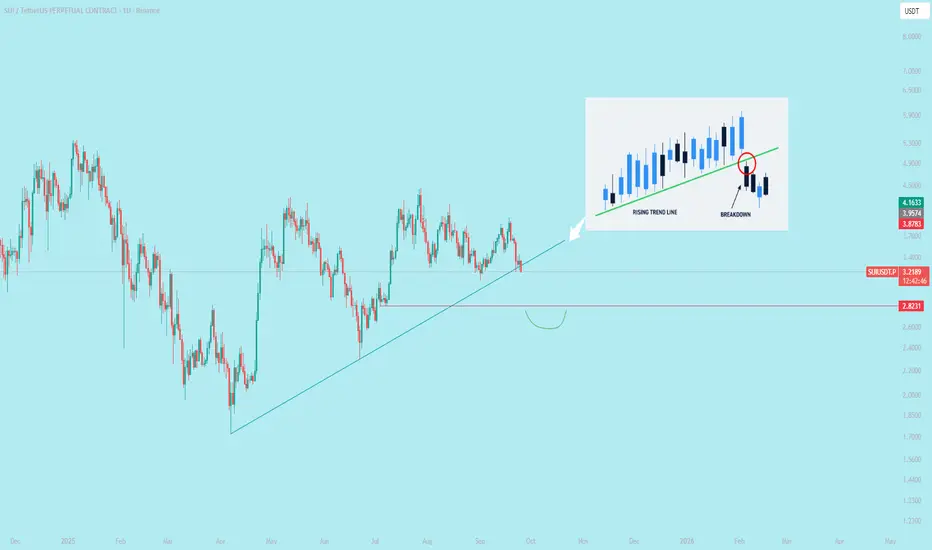
2. **Breakdown Process**:
- In an **uptrend**, a trendline connects higher lows, acting as support.
- A breakdown happens when the price closes below this trendline, suggesting buyers are losing control and sellers are gaining momentum.
- The break often indicates the end of the uptrend, potentially leading to a price decline or consolidation.
3. **Confirmation**:
- A single candle closing below the trendline may not confirm a breakdown.
- Traders often wait for additional signals, like a strong bearish candle, increased selling volume, or a retest of the trendline (where price fails to reclaim it).
4. **Key Factors**:
- **Volume**: Higher volume on the breakdown strengthens its validity.
- **Timeframe**: Breakdowns on longer timeframes (e.g., daily or weekly) are more significant than on shorter ones (e.g., hourly).
- **Retest**: Price may return to test the broken trendline as resistance before continuing downward.
5. **Implications**:
- A breakdown can signal a trend reversal (from bullish to bearish) or a temporary pullback.
- Traders may use it to enter short positions, set stop-losses above the trendline, or exit long positions.
6. **False Breakdowns**:
- Sometimes, price briefly dips below the trendline but quickly recovers, known as a "fake out."
- To avoid this, traders use additional indicators like moving averages, RSI, or support levels for confirmation.
**Note**: Always combine trendline analysis with other technical indicators and risk management, as breakdowns are not foolproof signals. Market conditions and news can also impact outcomes.
1. **Trendline Definition**: A trendline is a diagonal line drawn on a price chart connecting higher lows in an uptrend or lower highs in a downtrend, indicating support or resistance levels.
2. **Breakdown Process**:
- In an **uptrend**, a trendline connects higher lows, acting as support.
- A breakdown happens when the price closes below this trendline, suggesting buyers are losing control and sellers are gaining momentum.
- The break often indicates the end of the uptrend, potentially leading to a price decline or consolidation.
3. **Confirmation**:
- A single candle closing below the trendline may not confirm a breakdown.
- Traders often wait for additional signals, like a strong bearish candle, increased selling volume, or a retest of the trendline (where price fails to reclaim it).
4. **Key Factors**:
- **Volume**: Higher volume on the breakdown strengthens its validity.
- **Timeframe**: Breakdowns on longer timeframes (e.g., daily or weekly) are more significant than on shorter ones (e.g., hourly).
- **Retest**: Price may return to test the broken trendline as resistance before continuing downward.
5. **Implications**:
- A breakdown can signal a trend reversal (from bullish to bearish) or a temporary pullback.
- Traders may use it to enter short positions, set stop-losses above the trendline, or exit long positions.
6. **False Breakdowns**:
- Sometimes, price briefly dips below the trendline but quickly recovers, known as a "fake out."
- To avoid this, traders use additional indicators like moving averages, RSI, or support levels for confirmation.
**Note**: Always combine trendline analysis with other technical indicators and risk management, as breakdowns are not foolproof signals. Market conditions and news can also impact outcomes.
Operación cerrada: objetivo alcanzado
PERFCT DROP Exención de responsabilidad
The information and publications are not meant to be, and do not constitute, financial, investment, trading, or other types of advice or recommendations supplied or endorsed by TradingView. Read more in the Terms of Use.
Exención de responsabilidad
The information and publications are not meant to be, and do not constitute, financial, investment, trading, or other types of advice or recommendations supplied or endorsed by TradingView. Read more in the Terms of Use.