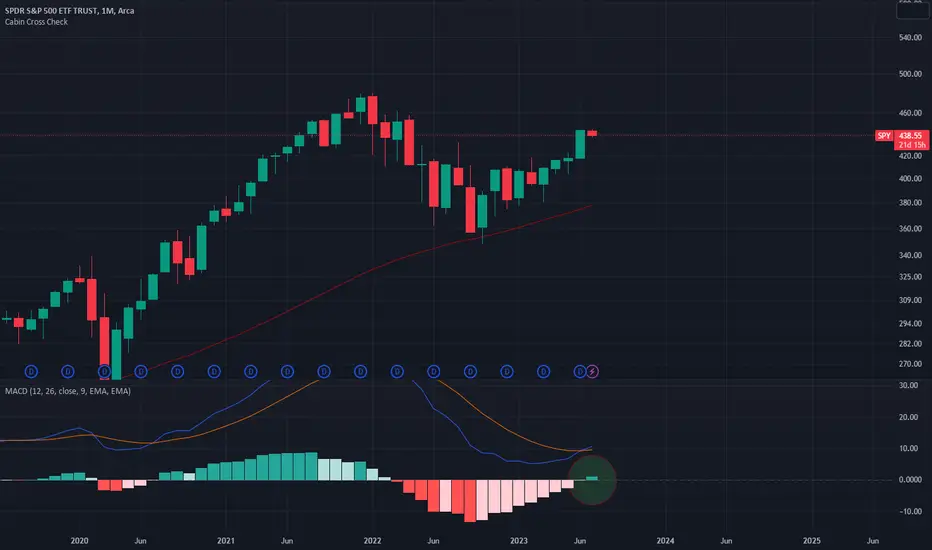
After nearly a 2 year-long absence, the monthly Moving Average Convergence Divergence (MACD) histogram has finally turned positive, signaling a potential shift in the market sentiment.
The appearance of the first green monthly MACD candle since August 2020 (following a massive selloff) for SPY in July 2023 is a notable technical development.
It suggests a potential shift in market sentiment and the possibility of a renewed or strengthened bullish trend. Market participants should closely monitor subsequent price action and additional indicators to confirm the sustainability of this momentum. As always, it is essential to exercise caution and conduct further analysis before making any investment decisions based on technical indicators alone.
The appearance of the first green monthly MACD candle since August 2020 (following a massive selloff) for
It suggests a potential shift in market sentiment and the possibility of a renewed or strengthened bullish trend. Market participants should closely monitor subsequent price action and additional indicators to confirm the sustainability of this momentum. As always, it is essential to exercise caution and conduct further analysis before making any investment decisions based on technical indicators alone.
Exención de responsabilidad
La información y las publicaciones que ofrecemos, no implican ni constituyen un asesoramiento financiero, ni de inversión, trading o cualquier otro tipo de consejo o recomendación emitida o respaldada por TradingView. Puede obtener información adicional en las Condiciones de uso.