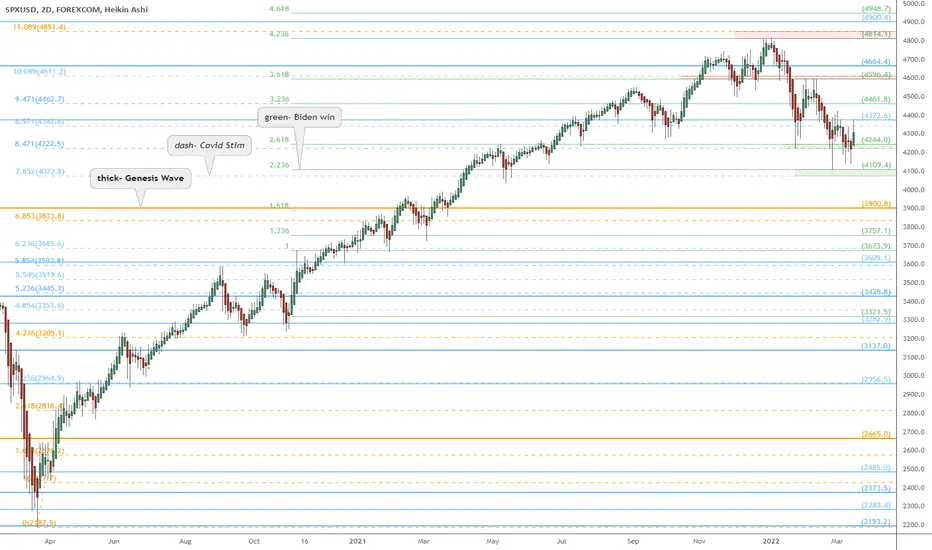
Plotted are 3 different sets of Fibonacci Extensions.
Each fib is like a "ruler" calibrated to a specific wave.
Every level is relevant, especially the confluence zones.
4372.6 is the key level to break and hold as bottom marker.
4343.6 is immediate support that strong bull would hold.
4222-4224 is key support for bulls to defend as a higher low.
4073-4019 should have been the bottom and NOT be retested.
For a closer look, check out this HOURLY view (click).
.
the Golden Ratio is my Religion
the Trading View is my Nation
the Moderator Tag is my Flag
the Trading View is my Nation
the Moderator Tag is my Flag
Publicaciones relacionadas
Exención de responsabilidad
La información y las publicaciones que ofrecemos, no implican ni constituyen un asesoramiento financiero, ni de inversión, trading o cualquier otro tipo de consejo o recomendación emitida o respaldada por TradingView. Puede obtener información adicional en las Condiciones de uso.