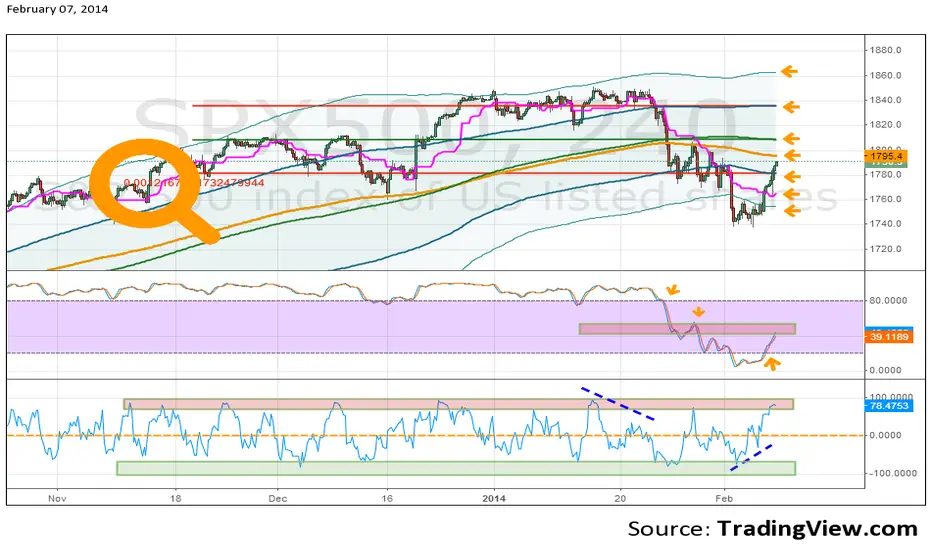
Plot LInear Regression as much as possible horizontal, close to 0.000
With the number YOU get plot EMA, BB with 1&2 deviation and Stoch.
For clues plot Ichimoku standard line and for divergence CMO or other indicators You like - settings according to your trading plan.
YOU can use this system on all timeframes - on lower timeframes You must change settings more often to plot horizontal LINREG... (use also different deviations of LINREG...
just WATCH, DECIDE, INNoVATE and make $$$ - GLT.
Exención de responsabilidad
La información y las publicaciones que ofrecemos, no implican ni constituyen un asesoramiento financiero, ni de inversión, trading o cualquier otro tipo de consejo o recomendación emitida o respaldada por TradingView. Puede obtener información adicional en las Condiciones de uso.