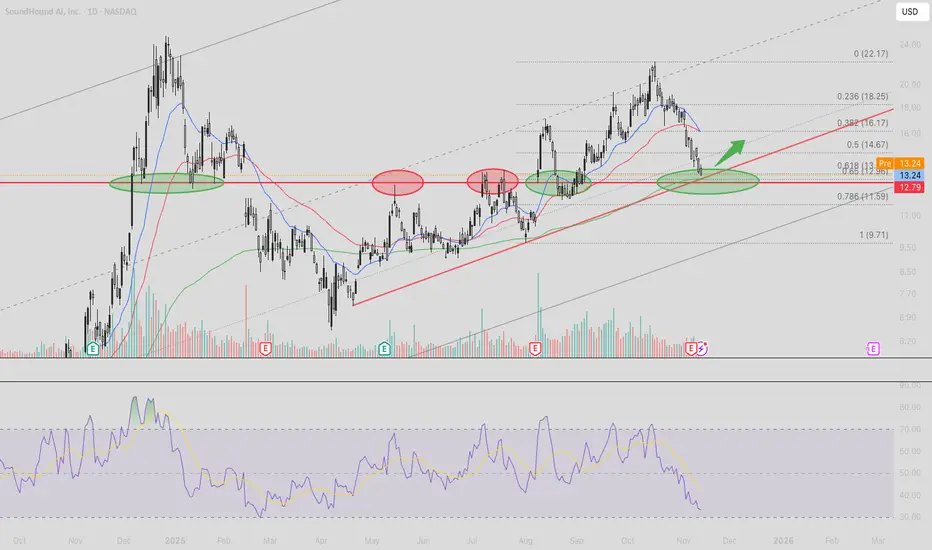
Analysis based on the daily timeframe. Price retraced sharply from recent highs and is now testing a major confluence area combining Fibonacci, trendline support, and prior structure. This zone has historically attracted buyers and often marks a higher-low formation in an active uptrend.
Structure
Key Levels
Fibonacci or Wave Targets
Outlook / Scenarios
Holding above the $12.8–$13.3 cluster keeps the daily bullish structure intact.
Structure
- Price pulled back into the 0.618 retracement of the full summer rally
- Retest of the rising trendline within the broader ascending channel
- Demand zone aligns with prior support/resistance flips
- RSI approaching oversold levels, consistent with pullback exhaustion
- Bias: cautiously bullish while holding above the current support cluster
Key Levels
- Support: $12.80–$13.30 (primary demand zone)
- Resistance: $14.70, $16.17, $18.25
- Invalidation: daily close below $12.50
Fibonacci or Wave Targets
- 0.618 retrace → $13.00 area (current reaction zone)
- 0.50 retrace → $14.67
- 0.382 retrace → $16.17
- 0.236 retrace → $18.25
Outlook / Scenarios
- Primary scenario – Price forms a higher low above $12.8–$13.3 and rebounds toward $14.7 and $16.1 as momentum recovers.
- Alternate scenario – Breakdown below $12.50 opens room toward $11.59 (0.786 fib) and potentially $9.70 if the trendline fails.
Holding above the $12.8–$13.3 cluster keeps the daily bullish structure intact.
Exención de responsabilidad
La información y las publicaciones no constituyen, ni deben considerarse como asesoramiento o recomendaciones financieras, de inversión, de trading o de otro tipo proporcionadas o respaldadas por TradingView. Más información en Condiciones de uso.
Exención de responsabilidad
La información y las publicaciones no constituyen, ni deben considerarse como asesoramiento o recomendaciones financieras, de inversión, de trading o de otro tipo proporcionadas o respaldadas por TradingView. Más información en Condiciones de uso.