🔎 Overview[/b]
⸻⸻⸻⸻⸻⸻⸻⸻⸻⸻⸻
📊 Chart Explanation
⸻⸻⸻⸻⸻ ⸻⸻⸻⸻⸻⸻
🟩 Summary
⸻⸻⸻⸻⸻⸻⸻⸻⸻⸻⸻
⚠️ Disclaimer
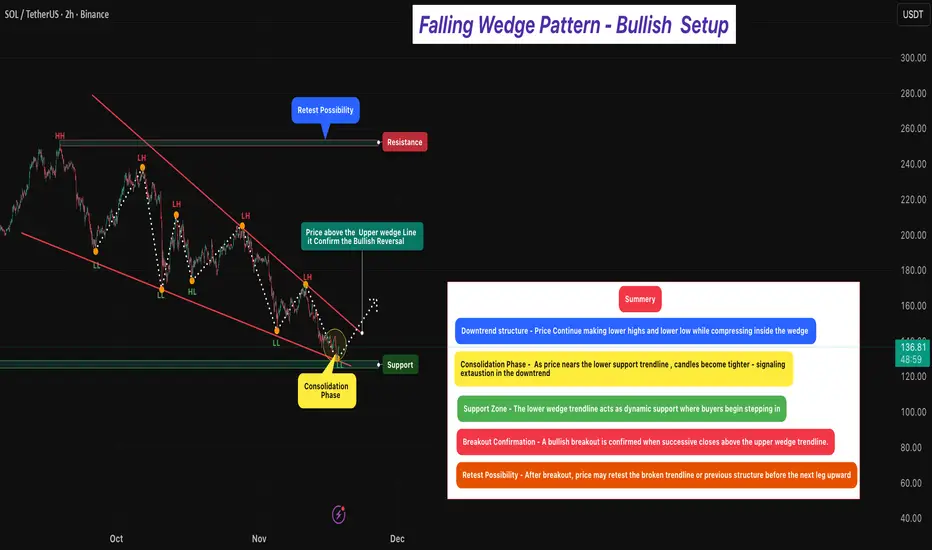
The Falling Wedge Pattern is a bullish reversal setup that forms when price trades inside a narrowing downward channel — creating lower highs and lower lows that converge toward the bottom.
It typically appears after a downtrend, signaling that selling pressure is weakening and buyers may soon regain control.
As price descends within the wedge, the slope begins to reduce and volatility tightens, indicating seller exhaustion and early buyer accumulation near support.
Momentum shifts once price breaks and closes above the upper wedge trendline, confirming a potential bullish reversal.
⸻⸻⸻⸻⸻⸻⸻⸻⸻⸻⸻
📊 Chart Explanation
1️⃣ Downtrend Structure
Price continues forming Lower Highs and Lower Lows within the wedge.
This compression reflects weakening bearish momentum.
2️⃣ Consolidation Phase
As price approaches the wedge’s lower line, candles narrow — indicating reduced volatility, seller fatigue, and early buying activity.
This is often the early reversal zone.
3️⃣ Support Zone
The lower wedge boundary overlaps with a strong structural support area — where buyers repeatedly defend the lows, forming a demand zone.
4️⃣ Breakout Confirmation
A bullish reversal is confirmed when price breaks and closes above the upper wedge line.
This signals a clear momentum shift from sellers → buyers.
5️⃣ Retest Possibility
Post-breakout, price may retest the broken wedge or prior resistance area.
A successful retest adds conviction to the continuation move.
⸻⸻⸻⸻⸻ ⸻⸻⸻⸻⸻⸻
🟩 Summary
• Pattern Type → Falling Wedge (Bullish Reversal)
A narrowing downward structure that signals seller exhaustion and early buyer accumulation.
• Bias → Bullish After Breakout Confirmation
Momentum shifts only when successive candles close firmly above the upper trendline, confirming a true breakout.
• Trend Context → Formed After a Downtrend
Makes the reversal stronger and increases the probability of upside continuation.
• Market Psychology → Sellers Losing Strength
Lower highs are losing momentum, and buyers are defending lows aggressively.
⸻⸻⸻⸻⸻⸻⸻⸻⸻⸻⸻
⚠️ Disclaimer
📘 For educational purposes only.
🙅 Not SEBI registered.
❌ Not a buy/sell recommendation.
🧠 Purely a learning resource.
📊 Not Financial Advice.
Publicaciones relacionadas
Exención de responsabilidad
La información y las publicaciones no constituyen, ni deben considerarse como asesoramiento o recomendaciones financieras, de inversión, de trading o de otro tipo proporcionadas o respaldadas por TradingView. Más información en Condiciones de uso.