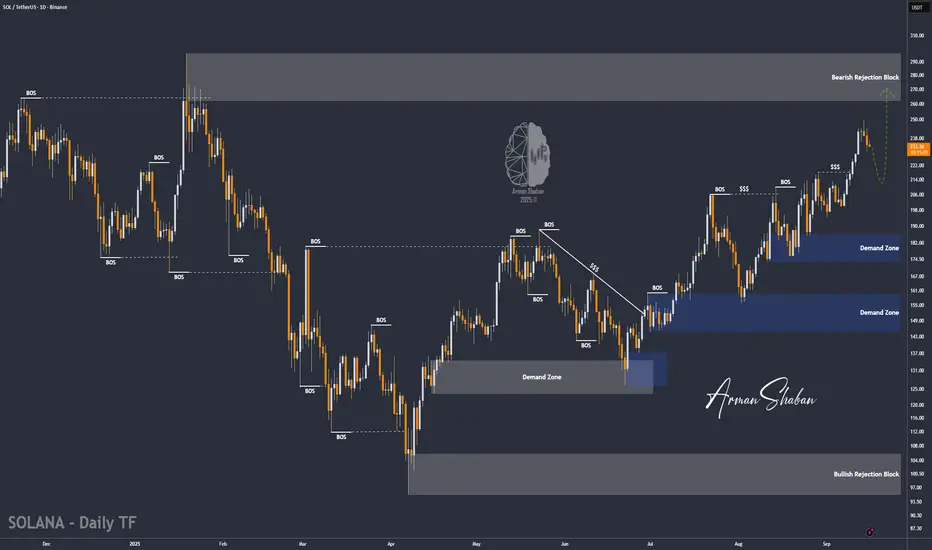
By analyzing the Solana chart on the daily timeframe, we can see that after a correction, the price is now trading around $234. In the short term, I expect a small pullback, followed by another strong bullish move from this coin.
The key demand zone is between $210–$220, while the possible upside targets are $250, $260, and $296.
Please support me with your likes and comments to motivate me to share more analysis with you and share your opinion about the possible trend of this chart with me !
Best Regards , Arman Shaban
The key demand zone is between $210–$220, while the possible upside targets are $250, $260, and $296.
Please support me with your likes and comments to motivate me to share more analysis with you and share your opinion about the possible trend of this chart with me !
Best Regards , Arman Shaban
Operación activa
By analyzing the Solana chart on the daily timeframe, we can see that the price is trading around $234. I expect a short correction here, followed by the start of the next bullish wave.The key demand zone is between $210–$220. If the price holds above $230, it could trigger the next bullish move, but for the uptrend to continue, a strong breakout above $250 is needed. The possible upside targets are $250, $260, and $296.
Operación cerrada: objetivo alcanzado
Since the last analysis, Solana (SOL) has climbed to $248, gaining more than 7% in just one day. The bullish momentum remains very strong, showing buyers are still in control.As long as SOL holds above the $230 support zone, the trend points higher. The next key upside targets remain at $250, $260, and $296.
⚜️ Free TG Channel : t.me/PriceAction_ICT
⚜️ Contact for VIP : t.me/ArmanShabanTrading
🎉 The Best Crypto Exchange ($100 Bonus) : lbank.com/ref/4Y77P
✅ One of the Best Forex Brokers (Lirunex) : bit.ly/4oCawfH
⚜️ Contact for VIP : t.me/ArmanShabanTrading
🎉 The Best Crypto Exchange ($100 Bonus) : lbank.com/ref/4Y77P
✅ One of the Best Forex Brokers (Lirunex) : bit.ly/4oCawfH
Publicaciones relacionadas
Exención de responsabilidad
La información y las publicaciones que ofrecemos, no implican ni constituyen un asesoramiento financiero, ni de inversión, trading o cualquier otro tipo de consejo o recomendación emitida o respaldada por TradingView. Puede obtener información adicional en las Condiciones de uso.