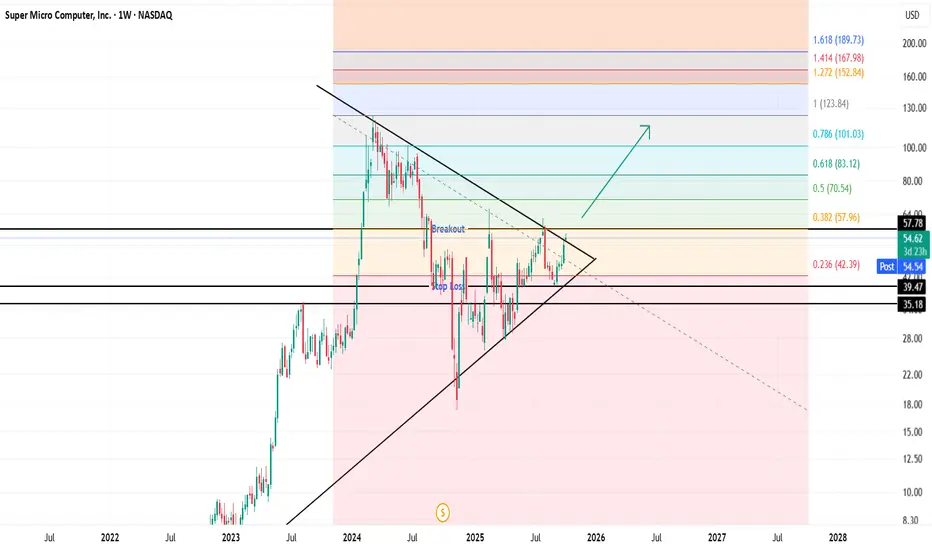
SMCI is at a major decision point. Wait for breakout confirmation above $57.78, use the triangle structure and Fibonacci extensions as your target zones, and manage risk via the marked stop levels. This technical setup combines classical charting with quantitative projections, providing a clear framework for swing traders and investors.
Key Levels and Setup
Symmetrical Triangle: Price is consolidating between converging trendlines, now nearing the apex, signaling an imminent breakout move.
Breakout Level: A sustained close above $57.78 (upper trendline/horizontal resistance) would confirm the bullish breakout.
Stop Loss: Clearly marked near the lower horizontal line (below $39.47 or $35.18) to protect against false breakouts.
Exención de responsabilidad
La información y las publicaciones que ofrecemos, no implican ni constituyen un asesoramiento financiero, ni de inversión, trading o cualquier otro tipo de consejo o recomendación emitida o respaldada por TradingView. Puede obtener información adicional en las Condiciones de uso.