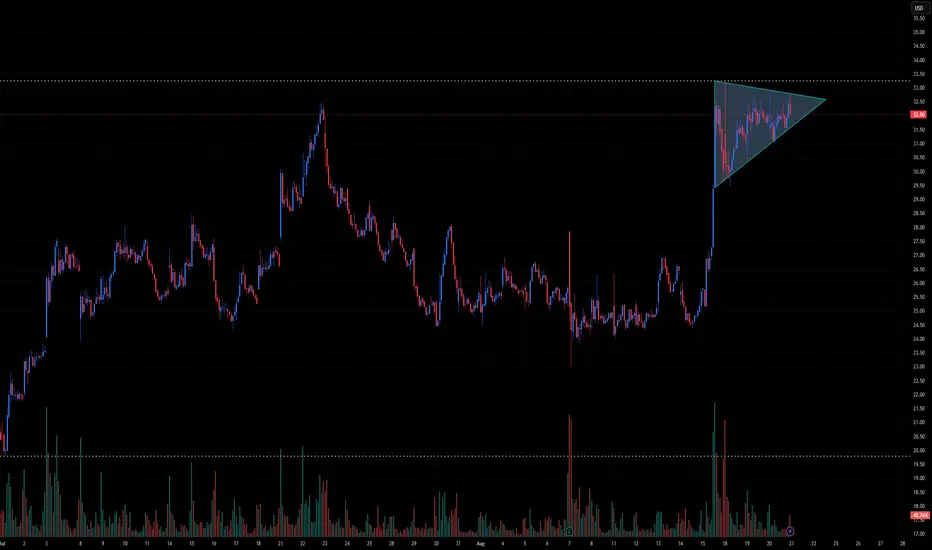
☀️ SEDG Technical Outlook – Symmetrical Triangle After Breakout Run
Ticker: SEDG (SolarEdge Technologies)
Timeframe: 30-minute candles
🔍 Current Setup
SEDG staged a sharp rally from ~$26 to ~$32.50, followed by a consolidation into a symmetrical triangle pattern. This setup represents a bullish continuation pattern, where buyers digest gains before attempting another leg higher.
Triangle Resistance: ~32.80–33.00
Triangle Support: ~31.80
Current price: ~32.10, near the triangle apex.
📊 Breakout Levels
🚀 Upside (Bullish Scenario)
Trigger: Break and close above 33.00.
Intermediate Targets:
34.00–34.50 → First supply zone.
35.50 → Extension target.
Measured Move Target: ~37.00 (projected from triangle height).
🔻 Downside (Bearish Scenario)
Trigger: Break below 31.80, then 30.80.
Intermediate Supports:
30.00 → Round number support.
28.50–28.00 → Demand zone.
Measured Move Target: ~27.00 (triangle height projection downward).
📈 Volume Analysis
Volume expanded during the initial rally but has contracted during consolidation — a classic sign of a triangle pattern.
Expect a sharp volume spike on breakout, confirming the move’s direction.
⚖️ Probability Bias
Given the strong uptrend leading into the triangle, the bias favors a bullish continuation if resistance at 33.00 is cleared.
However, failure to hold 31.80–30.80 would negate the bullish setup and reintroduce sellers.
✅ Takeaway
SEDG is at a critical inflection point within a bullish continuation pattern:
Bullish Break > 33.00: Targets 34.50 → 35.50 → 37.00
Bearish Break < 31.80 / 30.80: Targets 30.00 → 28.50 → 27.00
Watch for volume confirmation to validate the breakout direction.
Exención de responsabilidad
La información y las publicaciones no pretenden ser, ni constituyen, asesoramiento o recomendaciones financieras, de inversión, de trading o de otro tipo proporcionadas o respaldadas por TradingView. Más información en Condiciones de uso.
Exención de responsabilidad
La información y las publicaciones no pretenden ser, ni constituyen, asesoramiento o recomendaciones financieras, de inversión, de trading o de otro tipo proporcionadas o respaldadas por TradingView. Más información en Condiciones de uso.