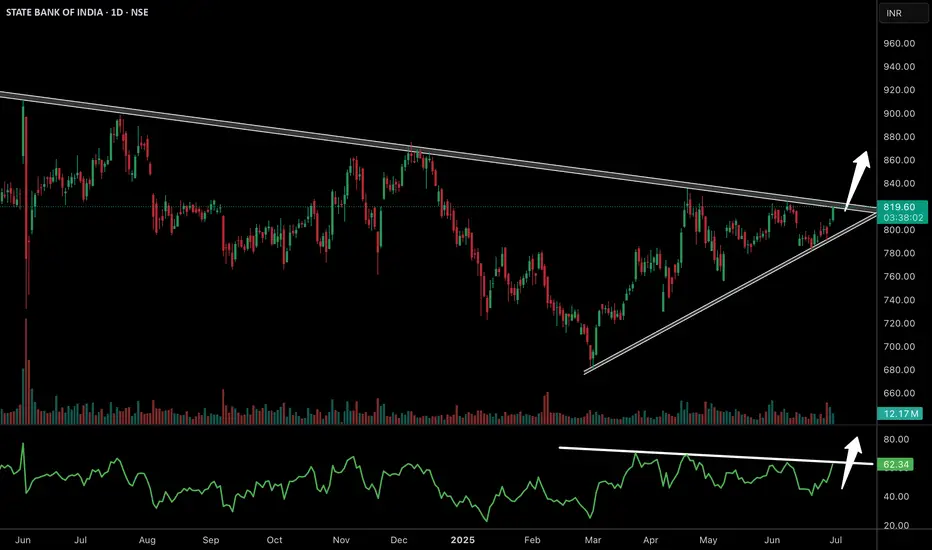
✅ The stock has formed a large symmetrical triangle pattern on the daily chart, with price compressing and now approaching the apex, suggesting a strong move is imminent.
✅ The recent candles show higher lows, confirming buyers are stepping in on every dip. RSI was in a falling wedge and has now broken to the upside above 62, indicating strengthening momentum.
✅ A clear breakout above the upper trendline near 825–830 with volume can lead to a sustained rally towards 880–920 levels in the coming weeks.
✅ PSU banks remain in focus with strong credit growth and stable asset quality. SBI being the largest lender, will benefit from robust business momentum.
Join our community in telegram for real time updates --- telegram.me/marketiik
Telegram- telegram.me/marketiik
A simple trader, distancing from the fake crowd. Simplifying complexity, I prioritize genuine insights over trends.
Telegram- telegram.me/marketiik
A simple trader, distancing from the fake crowd. Simplifying complexity, I prioritize genuine insights over trends.
Exención de responsabilidad
La información y las publicaciones que ofrecemos, no implican ni constituyen un asesoramiento financiero, ni de inversión, trading o cualquier otro tipo de consejo o recomendación emitida o respaldada por TradingView. Puede obtener información adicional en las Condiciones de uso.