📌 Market Context
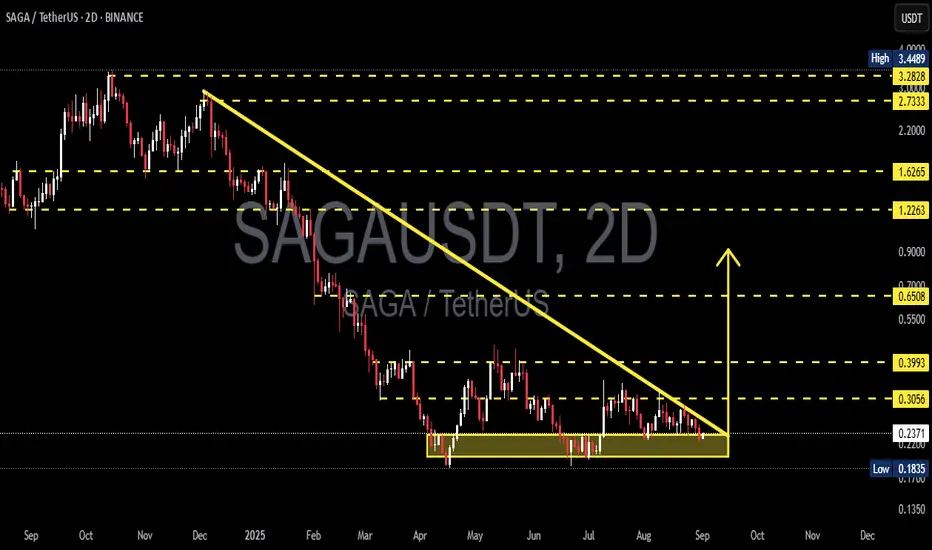
On the 2D timeframe, SAGA/USDT has been in a prolonged downtrend since late 2024 into early 2025. Recently, price action has formed a descending triangle: consistent lower highs pressing down against a flat demand zone at 0.22–0.24.
This structure reflects seller dominance (lower highs) while buyers continue to defend the same support. As price compresses into the apex of the triangle, volatility shrinks — signaling that a major move is imminent, either bullish breakout or bearish breakdown.
---
📊 Technical Structure & Key Levels
Key Demand Zone: 0.22 – 0.24 (highlighted in yellow)
Next Supports: 0.1835 (previous low), extension toward ~0.135 if breakdown accelerates
Stepwise Resistances:
0.3056 → first bullish validation
0.3993 → strong horizontal resistance
0.6508 → measured move confluence from triangle height
1.2263 → higher timeframe resistance
1.6265 → major resistance zone
2.7333 & 3.2828 → ambitious targets if macro bullish cycle resumes
Downtrend Line: descending resistance from multi-month highs, currently near 0.26–0.28
---
🟢 Bullish Scenario
Trigger:
Breakout above the downtrend line and a 2D close above 0.3056
Confirmation:
Increased volume + successful retest turning 0.27–0.305 into support
Targets:
T1: 0.3993
T2: 0.6508 (measured move projection)
T3: 1.2263 if momentum extends further
Alternative setup:
A fake breakdown below 0.22 followed by a quick reclaim above 0.23–0.24 could trigger a bear trap and squeeze price towards 0.3056/0.3993
Invalidation:
Failure above 0.3056 with price falling back under 0.26
---
🔴 Bearish Scenario
Trigger:
A decisive 2D close below 0.22 (triangle floor breakdown)
Confirmation:
Retest into 0.22–0.24 fails, flipping the zone into supply
Targets:
T1: 0.1835 (prior low)
T2: ~0.135 if sellers maintain pressure
Invalidation:
Price reclaims 0.24–0.26 with sustained strength
---
⚖️ Conclusion
The descending triangle on SAGAUSDT is now nearing completion, with price action coiling tightly around the 0.22–0.24 demand zone. Historically, this pattern favors continuation to the downside, but a bullish reversal remains possible if buyers reclaim control with a breakout above 0.3056.
In setups like this, traders often prepare for both scenarios instead of guessing direction:
React to the confirmed breakout or breakdown
Define clear invalidation levels for strict risk management
The market is reaching its decision point — the next move could be explosive.
#SAGA #SAGAUSDT #CryptoAnalysis #DescendingTriangle #PriceAction #ChartPattern #Breakout #Breakdown #CryptoTrading #SupportResistance #RiskManagement
✅ Get Free Signals! Join Our Telegram Channel Here: t.me/TheCryptoNuclear
✅ Twitter: twitter.com/crypto_nuclear
✅ Join Bybit : partner.bybit.com/b/nuclearvip
✅ Benefits : Lifetime Trading Fee Discount -50%
✅ Twitter: twitter.com/crypto_nuclear
✅ Join Bybit : partner.bybit.com/b/nuclearvip
✅ Benefits : Lifetime Trading Fee Discount -50%
Exención de responsabilidad
La información y las publicaciones que ofrecemos, no implican ni constituyen un asesoramiento financiero, ni de inversión, trading o cualquier otro tipo de consejo o recomendación emitida o respaldada por TradingView. Puede obtener información adicional en las Condiciones de uso.