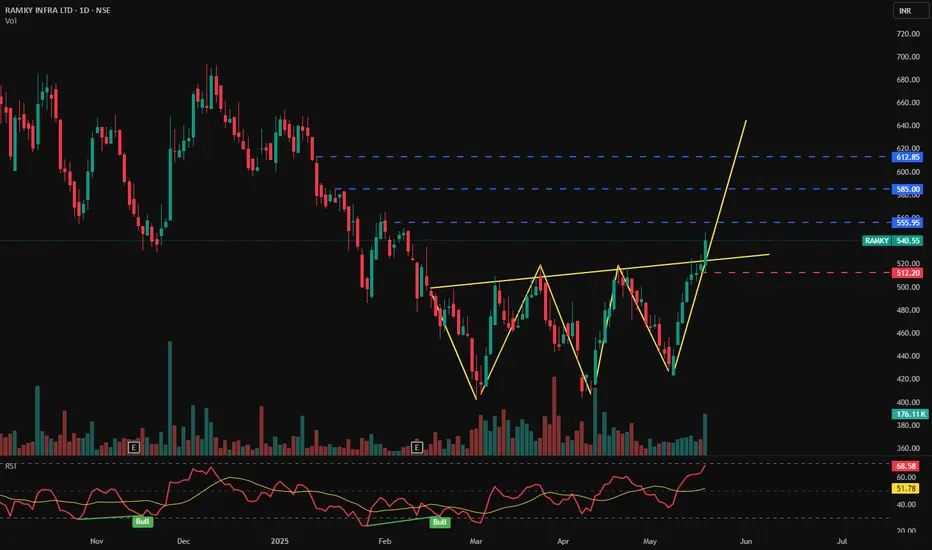
📊 RAMKY INFRA LTD (1D) – CMP ₹540.55
📅 Date: May 21, 2025
📈 Exchange: NSE
📌 Ticker: RAMKY
🧠 Technical Analysis Overview
✅ Bullish Inverse Head & Shoulders Pattern:
Price has broken out of a clearly formed inverse head and shoulders pattern — a powerful trend reversal structure — indicating a strong bullish sentiment and possible long-term uptrend.
✅ Breakout Confirmation:
A sharp breakout above the neckline near ₹512 has occurred with strong bullish momentum and increased volume.
✅ RSI Indicator – 📈
RSI is at 68.58, approaching overbought levels but not showing divergence yet, confirming continued bullish strength. The RSI trend also shows recent bullish crossovers.
📍 Key Price Levels
📌 Support
🟥 ₹512.20 – Neckline retest level (ideal re-entry zone)
📌 Resistance (Targets)
🔵 ₹555.95 – Immediate target
🔵 ₹585.00 – Mid-term resistance
🔵 ₹612.85 – Major resistance / final target from pattern projection
💬 Potential Strategy
Breakout Entry already active above neckline
Pullback Entry possible near ₹512–₹520
SL below ₹512
Target 1: ₹555
Target 2: ₹585
Target 3: ₹612+
📌 Conclusion
RAMKY INFRA is breaking out of a strong inverse head and shoulders pattern with bullish volume and RSI confirmation. Watch for a potential retest near ₹512 for a high-probability entry. Targets lie ahead at ₹555, ₹585, and ₹612.
🛑 Disclaimer:
This analysis is for educational purposes only. Not investment advice. Always DYOR or consult your financial advisor.
Operación cerrada: precio stop alcanzado
Exención de responsabilidad
La información y las publicaciones no constituyen, ni deben considerarse como asesoramiento o recomendaciones financieras, de inversión, de trading o de otro tipo proporcionadas o respaldadas por TradingView. Más información en Condiciones de uso.
Exención de responsabilidad
La información y las publicaciones no constituyen, ni deben considerarse como asesoramiento o recomendaciones financieras, de inversión, de trading o de otro tipo proporcionadas o respaldadas por TradingView. Más información en Condiciones de uso.