When price moves from below to above an AVWAP decisively, it signals short covering & a shift in control from sellers to buyers & when 2 or more AVWAPs converge liquidity concentrates, reversals or breakouts often happen there & these are the spots where traders take reversal trades, breakout entries, or stop placements
1. Using AVWAPs as a dynamic stop-loss is one of the simplest & most effective uses
2. An AVWAP is a useful trend filter
3. AVWAP + candlesticks = clean entry signals
As a high-level playbook, anchor VWAPs at major pivots (highs, lows, breakdowns, earnings gaps), trade pullbacks into rising AVWAPs during uptrends & trade rejects from falling AVWAPs in downtrends
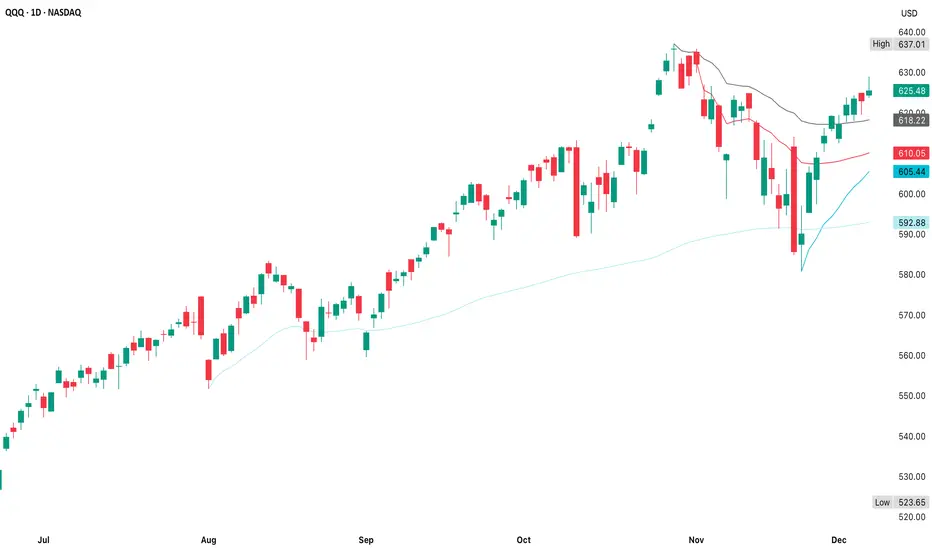
Price is above all AVWAPs
The ATH AVWAP is rising & firmly below price
The 3 & 21 November AVWAP are now support layers
Now that price is above all 3 major AVWAPs, the focus shifts to behavior around the ATH AVWAP & since price is above it already, there are only 2 meaningful reads
1. Bullish continuation setup
2. Price may pull back to the ATH AVWAP ($618)
Potential warning setup because trend deterioration begins with this move
The chart shows the exact 3 level anchored VWAP system that institutional traders use
This lets you map out short-term trend control (blue), intermediate-term supply absorption (red) & higher-timeframe trend health (gray) & right now, all of them say the same thing
ATH AVWAP
3 November breakdown AVWAP
21 Nov AVWAP - capitulation
Long-Term AVWAP
When all layers are stacked in ascending order like this, you get a fully aligned bull structure, clean pullback architecture, no overhead VWAP resistance, multi-cohort profit alignment & strong continuation behavior
These levels come directly from how institutions trade AVWAPs
1. ATH AVWAP (~$618) is the light pullback, common after a fast push off a low
2. 3 November AVWAP (~$610)
3. 21 November AVWAP (~$605)
4. Long-Term AVWAP (~$592)
Given the current AVWAP spacing & slope
- Right now, the 3 & 21 November AVWAPs are separated, meaning trend strength
- When they converge, it signals compression
1. Using AVWAPs as a dynamic stop-loss is one of the simplest & most effective uses
- If you're long above the 21 November AVWAP, the rising blue AVWAP is your dynamic stop
- A close below it should signal an exit
- It reflects the average buyer cost basis, not arbitrary price levels
2. An AVWAP is a useful trend filter
- Price above rising AVWAP(s) suggests a long bias
- Price below falling AVWAP(s) suggests short bias
- When price chops around a flattening AVWAP, stay out
- AVWAP is a trend health indicator
3. AVWAP + candlesticks = clean entry signals
- The strongest signals come when price pulls back into an AVWAP, prints a small reversal candle (hammer, doji, engulfing) & ATR is declining (just like now) since these become high-quality continuation entries
As a high-level playbook, anchor VWAPs at major pivots (highs, lows, breakdowns, earnings gaps), trade pullbacks into rising AVWAPs during uptrends & trade rejects from falling AVWAPs in downtrends
- Use converging AVWAPs as inflection points
- Use the nearest rising AVWAP as your stop
- Anchor to the close if the candle represents an event you want to capture (breakout, breakdown, a clear reversal bar, a candle where closing price indicates the market's verdict, earnings, FOMC, etc)
- Anchor to (H+L+C)/3 (the “typical price”) when you want a smoothed, less-biased VWAP for longer-term structures or swings
Typical price reduces noice from intraday spikes & avoids sensitivity to one extreme print or over-reaction to the tails on the candle (AVWAP from swing highs/lows or the start of a trend)
Price is above all AVWAPs
- This means all meaningful “cost basis cohorts” are beneath price
- The market is structurally repaired, at least in volume-weighted terms
- Overhead resistance from anchored supply does not exist right now
- This is a very different situation from when AVWAPs are stacked above price
The ATH AVWAP is rising & firmly below price
- This is one of the best signs of long-term trend health in AVWAP analysis
- When the ATH AVWAP is rising, decisively reclaimed & acting as near-term support, it usually tells you the prior correction has been fully absorbed
- Longs from the top are no longer underwater
- Selling pressure from those prior buyers is neutralized
- Trend followers using AVWAP logic have flipped their filters back to “risk-on”
- This is an objective, mathematical read & not a prediction
The 3 & 21 November AVWAP are now support layers
- 3 November (red) are breakdown-day sellers who are now underwater & this is a bullish dynamic because they can’t apply pressure
- 21 Nov (blue) are capitulation low buyers, still profitable & in control - primary support
- Together, these form a layered support around $605-$612, or the area where dip-buyers have historically stepped-in
- A stop-loss location for AVWAP-based trading systems
Now that price is above all 3 major AVWAPs, the focus shifts to behavior around the ATH AVWAP & since price is above it already, there are only 2 meaningful reads
1. Bullish continuation setup
2. Price may pull back to the ATH AVWAP ($618)
- Find buyers (hammer, doji, small-range reversal) & then move away
- This is one of Brian Shannon’s highest-probability setups (reclaim AVWAP → pullback → higher low → continuation)
Potential warning setup because trend deterioration begins with this move
- Price closes below the ATH AVWAP
- Then stays below it for multiple sessions
- Slope begins to flatten or roll over
- This would be your first objective sign that the trend is losing strength from an anchored-volume standpoint
The chart shows the exact 3 level anchored VWAP system that institutional traders use
- A correction-low AVWAP (21 November)
- A breakdown-event AVWAP (3 November)
- A structural high AVWAP (ATH)
This lets you map out short-term trend control (blue), intermediate-term supply absorption (red) & higher-timeframe trend health (gray) & right now, all of them say the same thing
- Price is in a state of repaired, orderly trend with all major AVWAPs providing support beneath
ATH AVWAP
- Defines trend health at the highest timeframe visible on your chart
- Swing traders, late buyers at the highs, trend-following algos
- When price is above the ATH AVWAP then the uptrend is structurally intact
- When price is below it then long-term players are underwater, trend is suspect
- QQQ is above the ATH AVWAP (~$618)
- This means that ATH buyers are profitable again
- The first high-quality pullback often tags this line in early trend repair phases
- A reclaim → retest → hold sequence is extremely bullish behavior
3 November breakdown AVWAP
- Tracks sellers from major breakdowns or panic candles
- Funds that sold into weakness, systematic risk-off flows
- If price is above it then that entire selling cohort is underwater
- These traders become forced buyers on pullbacks or breakouts
- AVWAP ~$610
- Price is above it then supply from that breakdown is absorbed
- This AVWAP becomes support on deeper pullbacks
- If price tags it then watch for immediate dip-buying
21 Nov AVWAP - capitulation
- Tracks the cost basis of buyers who stepped in at the emotional low
- Aggressive reversal traders, deep-value algos, CTA re-leveraging
- This is the most important rising support line in the model
- When price is above it, the reversal cohort is still in control
- A close below it often signals trend exhaustion
- AVWAP ~$605
- Price is well above it & the slope is rising aggressively
- As long as price respects this AVWAP, the recovery trend remains clean
- If price pulls back to it then this is a high-odds rotation/continuation buy point
Long-Term AVWAP
- This is the long rising AVWAP on your chart (~$592)
- It acts as deep trend support
- The line separating bull vs bear structure
- The highest timeframe “fair value” of the entire trend leg
- A tag here marks trend reset, not breakdown
- A break below this layer shifts the market into caution
- This long AVWAP is safely under price so the long-cycle trend remains intact
When all layers are stacked in ascending order like this, you get a fully aligned bull structure, clean pullback architecture, no overhead VWAP resistance, multi-cohort profit alignment & strong continuation behavior
- This model is about control, not prediction & right now, the bullish alignment is simply a fact of structure
These levels come directly from how institutions trade AVWAPs
1. ATH AVWAP (~$618) is the light pullback, common after a fast push off a low
- Signals to watch for include a hammer/doji at the AVWAP
- Lower wick rejection
- ATR contraction & reversal
- Reclaim → hold → push
- This is the first layer most swing traders buy
2. 3 November AVWAP (~$610)
- This is the mid-depth pullback
- It’s usually triggered when short-term longs trim
- Expect a strong buyer reaction
- 1-2 days of stabilizing candles
- Momentum traders stepping back in
- This is a very strong continuation level in AVWAP systems
3. 21 November AVWAP (~$605)
- This is the high-value dip
- This line is VWAP traders’ favorite
- It represents the true reversal cohort’s cost basis
- It has been respected perfectly
- It rises steadily each day
- It marks the “line of trend continuation”
- If price reaches this AVWAP, this is often the highest-probability buy in the entire structure
- Rejecting here = trend continuation
- Closing below = trend fatigue
4. Long-Term AVWAP (~$592)
- This is the deep reset, not a casual dip
- If price ever hits this momentum is gone, trend is resetting, higher timeframe traders reassess, hedge funds rotate & isk allocation shifts
- This is not a breakdown, but it is a significant tone-change
- You rarely see this tested unless markets enter a broader digestion phase
Given the current AVWAP spacing & slope
- $618 (ATH AVWAP) is highly actionable
- $610 (3 November AVWAP) is a strong level
- $605 (21 November AVWAP) is an institutional-grade support
- When price is above all 3, VWAP traders don’t look for tops - they monitor control transitions
I am not a licensed professional & these posts are for informational purposes only, not financial advice.
Exención de responsabilidad
La información y las publicaciones no constituyen, ni deben considerarse como asesoramiento o recomendaciones financieras, de inversión, de trading o de otro tipo proporcionadas o respaldadas por TradingView. Más información en Condiciones de uso.