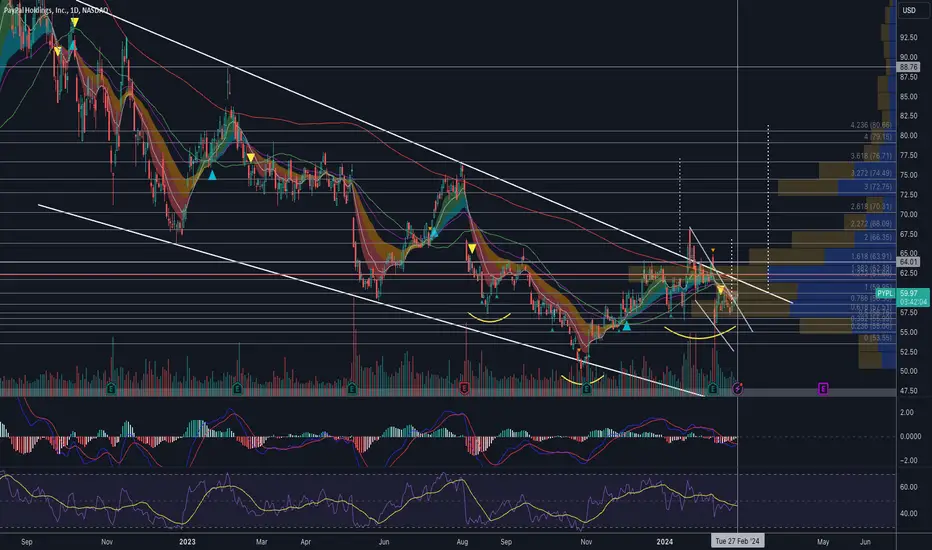
There are multiple patterns at play:
✅Inverse head and shoulder
✅Multi-year descending wedge
✅Near-term descending wedge breakout
The $60 to $64 area would be a critical resistance area, as it is the area where multiple factors are working against the bulls:
✅POC volume profile resistance
✅50 DMA
✅200 DMA
✅Wedge trendline resistance.
So if the bulls can clear that resistance area, the stock can run to as high as $80 area.
Here are upside targets:
$62.50 - $64
$66
$72
$80
Downside risk:
$53
I am not a licensed professional. None of the posts that I published are investment advice. Do your own research.
Exención de responsabilidad
La información y las publicaciones que ofrecemos, no implican ni constituyen un asesoramiento financiero, ni de inversión, trading o cualquier otro tipo de consejo o recomendación emitida o respaldada por TradingView. Puede obtener información adicional en las Condiciones de uso.