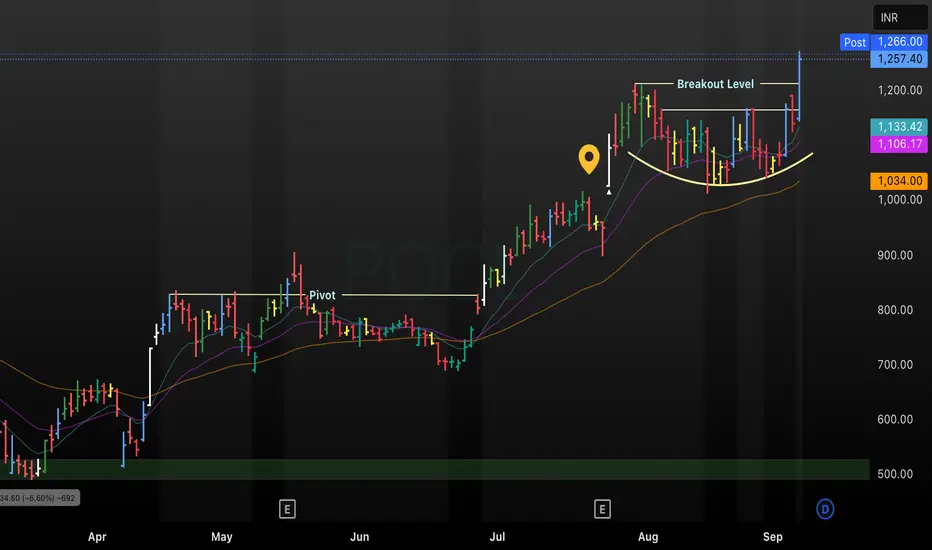
This annotated POCL daily chart tracks price movement from April to September 2025, displaying key technical events including a consolidation pivot, formation of a rounded base, and recent breakout above a major resistance level. Multiple moving averages (including short, medium, and long-term) support bullish momentum, with price closing above the breakout level and confirming a new uptrend. The setup provides trade entry signals and evidence of strengthening market structure for POCL as of September 20
Exención de responsabilidad
La información y las publicaciones no constituyen, ni deben considerarse como asesoramiento o recomendaciones financieras, de inversión, de trading o de otro tipo proporcionadas o respaldadas por TradingView. Más información en Condiciones de uso.
Exención de responsabilidad
La información y las publicaciones no constituyen, ni deben considerarse como asesoramiento o recomendaciones financieras, de inversión, de trading o de otro tipo proporcionadas o respaldadas por TradingView. Más información en Condiciones de uso.