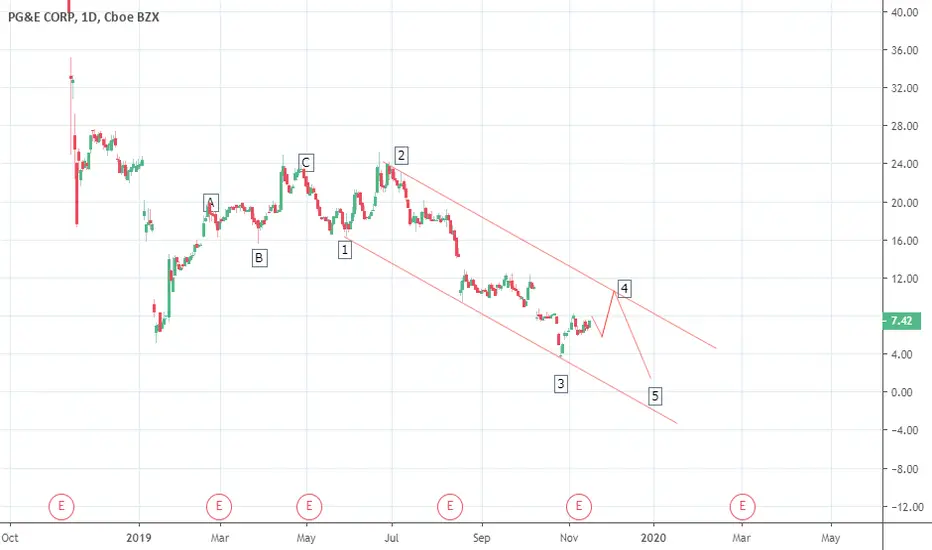
After my daily stare at the PCG chart, I noticed that the low from January to the high in April was in 3 waves, and fits with a classic zigzag, but then there was some sideways movement afterwards. This could be sideways consolidation as part of the corrective move up from January lows. Or it could be a 1-2 as part of the down move that started as shown in the chart.
It's always important to keep an open mind. I believe this chart makes the most sense from a long to medium term stand point. If that is the case, then we are currently in wave 4 of this down move and will retrace to 10 area before falling below 3.
Also this current bounce is a lot weaker than Januarys bounce so I don't see us getting past 11 by the end of the year.
Exención de responsabilidad
La información y las publicaciones que ofrecemos, no implican ni constituyen un asesoramiento financiero, ni de inversión, trading o cualquier otro tipo de consejo o recomendación emitida o respaldada por TradingView. Puede obtener información adicional en las Condiciones de uso.