📈 Current Price Snapshot
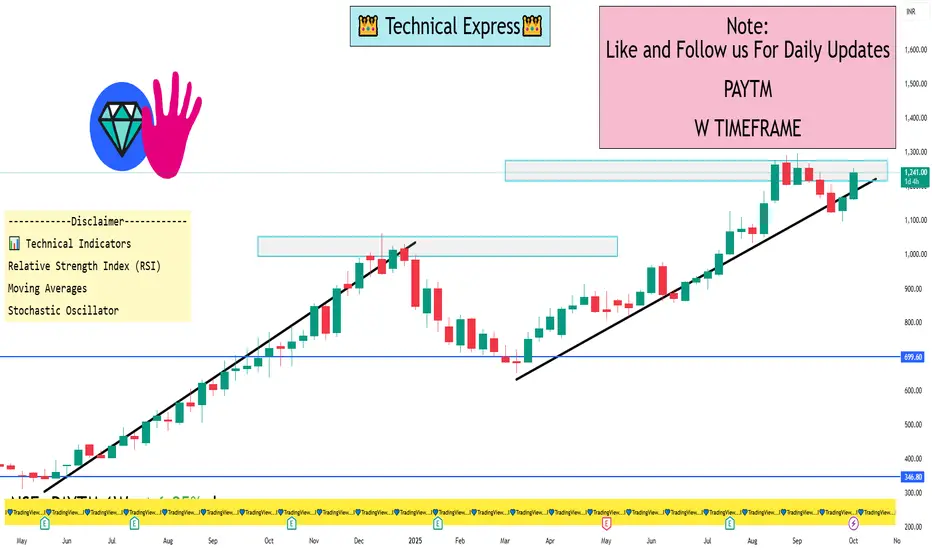
Latest Price: ₹1,241.50
Day's Range: ₹1,224.30 – ₹1,247.80
52-Week Range: ₹651.50 – ₹1,296.60
🔧 Key Technical Levels (1-Week Timeframe)
Resistance Levels:
₹1,247.80 – Recent intraday high
₹1,288.30 – Near-term resistance zone
Support Levels:
₹1,224.30 – Recent intraday low
₹1,119.00 – Short-term support
📊 Technical Indicators
Relative Strength Index (RSI): 57.67 – Indicates bullish momentum without being overbought.
Moving Averages: Both short-term and long-term moving averages are in a bullish alignment, supporting the positive trend.
Stochastic Oscillator: In the bullish zone, suggesting continued upward momentum.
🧭 Summary
The stock is currently trading near its recent intraday high, indicating strong bullish momentum. With RSI and moving averages supporting the uptrend, PAYTM appears poised to test higher resistance levels in the near term. However, investors should monitor the stock's movement near the resistance level of ₹1,288.30 for potential breakout or reversal signals.
I built a Buy & Sell Signal Indicator with 85% accuracy.
📈 Get access via DM or
WhatsApp: wa.link/d997q0
| Email: techncialexpress@gmail.com
| Script Coder | Trader | Investor | From India
📈 Get access via DM or
WhatsApp: wa.link/d997q0
| Email: techncialexpress@gmail.com
| Script Coder | Trader | Investor | From India
Publicaciones relacionadas
Exención de responsabilidad
La información y las publicaciones que ofrecemos, no implican ni constituyen un asesoramiento financiero, ni de inversión, trading o cualquier otro tipo de consejo o recomendación emitida o respaldada por TradingView. Puede obtener información adicional en las Condiciones de uso.