1️⃣ Overall Price Structure (Price Action)
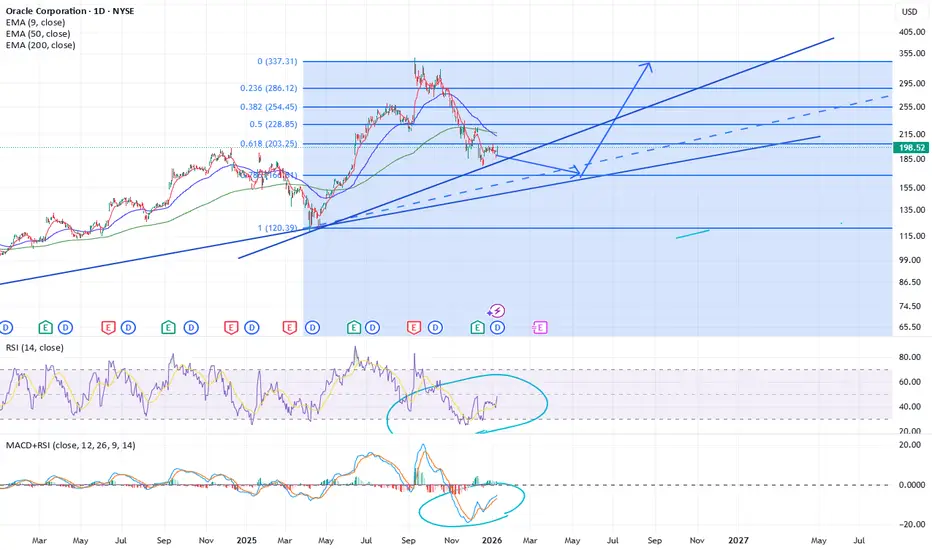
The long-term trend is still bullish (the ascending channel you drew is valid).
After topping around 300–320, price entered a deep correction.
Currently, price is trading near the lower boundary of the rising channel and a key support zone.
2️⃣ Fibonacci Levels
The Fibonacci levels you marked are very relevant:
0.618 ≈ $203 → Major support (price is hovering around this level now)
0.5 ≈ $228 → Mid resistance
0.382 ≈ $254 → Strong resistance
0.236 ≈ $286 → Heavy resistance
Previous high ≈ $330–340
📌 As long as $203 holds, the bullish scenario remains valid.
3️⃣ Moving Averages (EMA)
EMA 200 ≈ $217 → Price is below it → short-term weakness
EMA 50 ≈ $213 → Dynamic resistance
EMA 9 ≈ $194 → Price is slightly above it
📌 For a confirmed reversal:
Hold above EMA 9
Break and hold EMA 50
Reclaim EMA 200
4️⃣ RSI (14)
RSI is around 42–48
Recovering from oversold conditions
A mild bullish divergence is forming (your circled area is correct)
📌 Selling pressure is decreasing, but bullish momentum is not strong yet.
5️⃣ MACD
MACD is still below zero
Forming a higher low
Lines are close to a bullish crossover
📌 This usually happens before the start of a bullish move.
6️⃣ Scenarios
🟢 Bullish Scenario (More Probable)
If:
$200–203 support holds
Price reclaims $215–220
Targets:
$228
$254
$286
Strong breakout → $320–340
(The upward arrow you drew is technically sound.)
🔴 Bearish Scenario (Invalidation)
If:
Daily close below $195–190
Downside targets:
$170–165
Worst case: $120–130 (Fib 1.0)
7️⃣ Quick Summary
Long-term: Bullish
Short-term: Corrective / consolidation
Key level: $203
Bias: Cautiously bullish
⚠️ Disclaimer: This analysis reflects my personal technical view only. I take no responsibility for any buy or sell decisions made based on this analysis.
Exención de responsabilidad
La información y las publicaciones no constituyen, ni deben considerarse como asesoramiento o recomendaciones financieras, de inversión, de trading o de otro tipo proporcionadas o respaldadas por TradingView. Más información en Condiciones de uso.
Exención de responsabilidad
La información y las publicaciones no constituyen, ni deben considerarse como asesoramiento o recomendaciones financieras, de inversión, de trading o de otro tipo proporcionadas o respaldadas por TradingView. Más información en Condiciones de uso.