ONGC Ltd – Breakout Retest in Progress
 ONGC
ONGC
📈 Pattern & Setup:
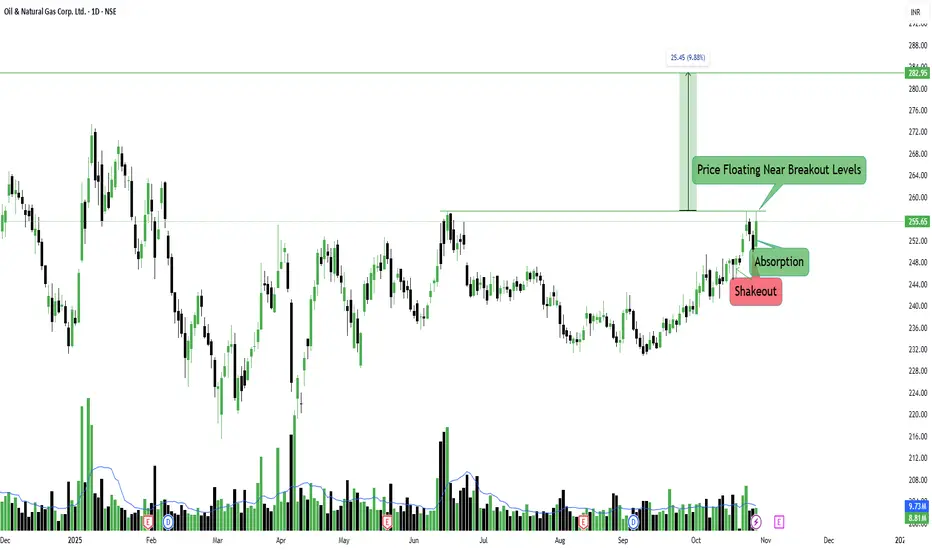
ONGC has been showing a consistent bullish structure with higher lows and a breakout attempt above the key resistance zone around 254–256. The recent breakout candle was supported by a healthy volume spike, signaling genuine buying interest from institutions.
After the breakout, the stock pulled back slightly to retest the breakout zone — a typical price behavior before continuation. This retest phase is crucial as it often separates short-term traders from strong holders.
If the stock sustains above 254 with volume confirmation, it may start its next leg toward 282–285 levels, aligning with its 9.88% projected move from the breakout range.
📝 Trade Plan:
✍Entry: Above 257 (confirmation after retest)
🚩Stop-Loss: 246 (below recent swing low)
🎯Targets:
Target 1 → 270
Target 2 → 282 (around 10% potential move)
💡 Pyramiding Strategy:
1. Enter 60% above 257 after confirmation of retest
2. Add 40% above 262 once strong volume returns
3. Trail stop-loss to 252 once the stock trades above 270
Keep Learning. Keep Earning.
Let’s grow together 📚🎯
🔴Disclaimer:
This analysis is for educational purposes only. Not a buy/sell recommendation. Please do your own research or consult your financial advisor before trading.
📈 Pattern & Setup:
ONGC has been showing a consistent bullish structure with higher lows and a breakout attempt above the key resistance zone around 254–256. The recent breakout candle was supported by a healthy volume spike, signaling genuine buying interest from institutions.
After the breakout, the stock pulled back slightly to retest the breakout zone — a typical price behavior before continuation. This retest phase is crucial as it often separates short-term traders from strong holders.
If the stock sustains above 254 with volume confirmation, it may start its next leg toward 282–285 levels, aligning with its 9.88% projected move from the breakout range.
📝 Trade Plan:
✍Entry: Above 257 (confirmation after retest)
🚩Stop-Loss: 246 (below recent swing low)
🎯Targets:
Target 1 → 270
Target 2 → 282 (around 10% potential move)
💡 Pyramiding Strategy:
1. Enter 60% above 257 after confirmation of retest
2. Add 40% above 262 once strong volume returns
3. Trail stop-loss to 252 once the stock trades above 270
Keep Learning. Keep Earning.
Let’s grow together 📚🎯
🔴Disclaimer:
This analysis is for educational purposes only. Not a buy/sell recommendation. Please do your own research or consult your financial advisor before trading.
TrendX INC
Publicaciones relacionadas
Exención de responsabilidad
La información y las publicaciones no constituyen, ni deben considerarse como asesoramiento o recomendaciones financieras, de inversión, de trading o de otro tipo proporcionadas o respaldadas por TradingView. Más información en Condiciones de uso.