1. Pattern Analysis
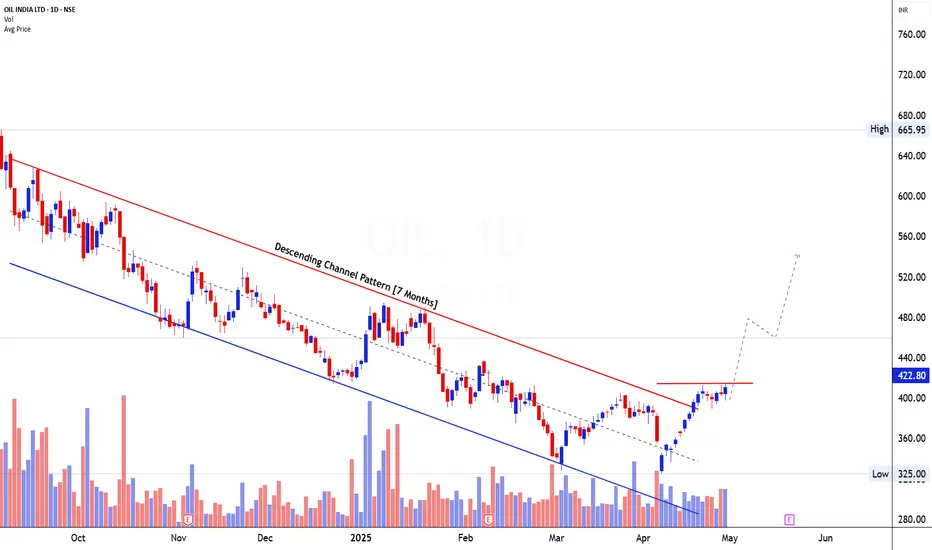
Oil India Ltd has formed a Descending Channel Pattern over the last 7 months, which qualifies as a tradable setup based on Mr. Chartist’s framework. The pattern is visually clear with well-respected trendlines: the red trendline marks resistance while the blue defines support. This bearish channel has consistently contained price within lower highs and lower lows, but the recent price action shows a strong approach toward the channel’s upper boundary. A smaller horizontal resistance line also emerges just below ₹425, adding another layer of confluence for a potential breakout area.
2. Volume Analysis
Volume has shown constructive behavior in recent sessions, particularly during the rise from the lower boundary of the channel. The recent rally off the lows is accompanied by increasing volume, reflecting strong accumulation. Compared to the lower volume during the downtrend phases inside the channel, the expansion of volume on bullish candles stands out. The surge in volume at support and during breakout attempts is a positive confirmation of underlying demand and investor interest building up at these levels.
3. Candlestick/Price Analysis
The candlestick structure has evolved into a sequence of strong bullish candles as the price rebounded from near ₹325. These candles exhibit conviction, with higher closes and narrowing wicks, which suggests diminishing selling pressure. The most recent candle has approached the critical horizontal and channel resistance around ₹422–₹425. This level is psychologically important as it also aligns with the previous swing highs, forming a localized resistance zone. A breakout above this level, if accompanied by high volume and a wide-range bullish candle, would be a strong reversal signal.
4. Validation of Signal
The signal is nearing confirmation. The combination of a long-term descending channel pattern nearing the end of its structure and the clustering of resistance at ₹425 offers a textbook breakout opportunity. The price has risen rapidly from the channel’s lower support, breaking internal downtrend lines and marching toward resistance. Once price closes and sustains above the ₹425 mark with strength, this would validate the breakout from the descending channel pattern and indicate a shift from downtrend to uptrend.
5. Tradable Points Determination
Entry Point Determination
The ideal entry point would be on a confirmed breakout above ₹425, supported by volume. Traders looking for aggressive entry can consider initiating partial positions between ₹420–₹425 while watching for a strong breakout candle.
Target Point Determination
The channel’s height ranges between ₹550 and ₹325, giving a measured move target of around ₹200. Adding this to the breakout level of ₹425 gives a price target near ₹625, which also aligns with prior price memory zones.
Stop Loss Placement and Trailing SL Follow-Up
A logical stop loss can be placed below the recent swing low at ₹385. Once the breakout is confirmed and price sustains above ₹450, the SL can be trailed to ₹425 (breakout level). Further trailing can follow swing lows as the stock progresses higher toward the ₹500 and ₹600 zones, protecting profits while remaining in the trend.
Learn Today for Better Tomorrow
Exención de responsabilidad
La información y las publicaciones no pretenden ser, ni constituyen, asesoramiento o recomendaciones financieras, de inversión, de trading o de otro tipo proporcionadas o respaldadas por TradingView. Más información en Condiciones de uso.
Learn Today for Better Tomorrow
Exención de responsabilidad
La información y las publicaciones no pretenden ser, ni constituyen, asesoramiento o recomendaciones financieras, de inversión, de trading o de otro tipo proporcionadas o respaldadas por TradingView. Más información en Condiciones de uso.