📉 OBEROI REALTY LTD – Double Bottom but Failed Breakout Retest
📅 Date: April 28, 2025
📈 Timeframe: Daily Chart
🔍 Stock: Oberoi Realty Ltd (NSE)
📌 Technical Overview:
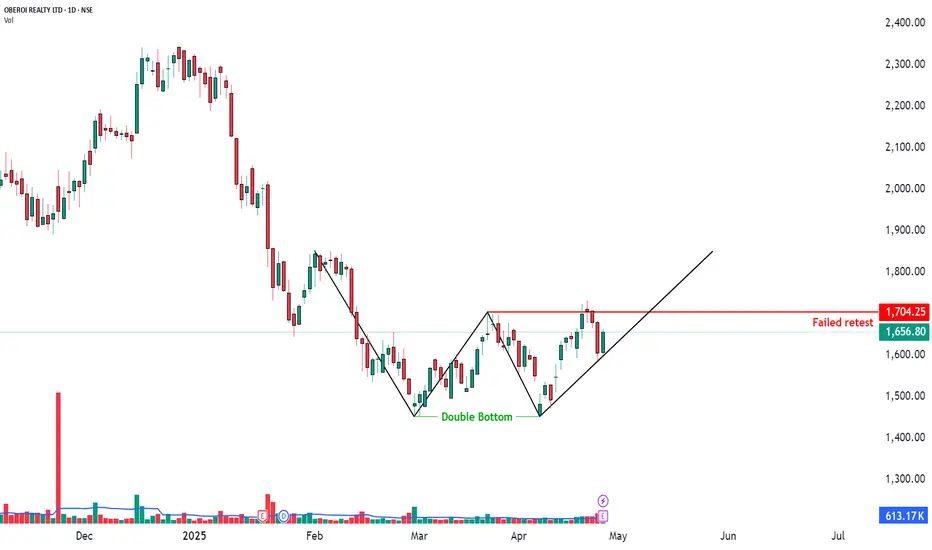
A Double Bottom pattern was formed indicating bullish reversal potential.
Price attempted a breakout above the neckline near ₹1704.25, but the retest failed — price could not sustain above the breakout zone.
Price is currently trading at ₹1656.80, under the trendline support.
🧩 Key Observations:
✅ Double bottom structure was confirmed.
❌ Breakout retest failed — caution needed.
📉 Watch trendline support (black line) closely — breakdown could trigger weakness.
📊 Volume during the failure was moderate (not aggressive selling yet).
🧠 Observational Bias:
Weak below the trendline support.
Bulls must reclaim and hold above ₹1704.25 to regain strength.
📅 Date: April 28, 2025
📈 Timeframe: Daily Chart
🔍 Stock: Oberoi Realty Ltd (NSE)
📌 Technical Overview:
A Double Bottom pattern was formed indicating bullish reversal potential.
Price attempted a breakout above the neckline near ₹1704.25, but the retest failed — price could not sustain above the breakout zone.
Price is currently trading at ₹1656.80, under the trendline support.
🧩 Key Observations:
✅ Double bottom structure was confirmed.
❌ Breakout retest failed — caution needed.
📉 Watch trendline support (black line) closely — breakdown could trigger weakness.
📊 Volume during the failure was moderate (not aggressive selling yet).
🧠 Observational Bias:
Weak below the trendline support.
Bulls must reclaim and hold above ₹1704.25 to regain strength.
Operación activa
Trailing @ 1775Nota
Keep Trailing on DCBSTWP | Mentor & Demand-Supply Specialist | Empowering traders through structured learning |
simpletradewithpatience.com
Community: chat.whatsapp.com/BEYz0tkqP0fJPBCWf59uel
wa.me/message/6IOPHGOXMGZ4N1
Educational Only
simpletradewithpatience.com
Community: chat.whatsapp.com/BEYz0tkqP0fJPBCWf59uel
wa.me/message/6IOPHGOXMGZ4N1
Educational Only
Exención de responsabilidad
La información y las publicaciones no constituyen, ni deben considerarse como asesoramiento o recomendaciones financieras, de inversión, de trading o de otro tipo proporcionadas o respaldadas por TradingView. Más información en Condiciones de uso.
STWP | Mentor & Demand-Supply Specialist | Empowering traders through structured learning |
simpletradewithpatience.com
Community: chat.whatsapp.com/BEYz0tkqP0fJPBCWf59uel
wa.me/message/6IOPHGOXMGZ4N1
Educational Only
simpletradewithpatience.com
Community: chat.whatsapp.com/BEYz0tkqP0fJPBCWf59uel
wa.me/message/6IOPHGOXMGZ4N1
Educational Only
Exención de responsabilidad
La información y las publicaciones no constituyen, ni deben considerarse como asesoramiento o recomendaciones financieras, de inversión, de trading o de otro tipo proporcionadas o respaldadas por TradingView. Más información en Condiciones de uso.