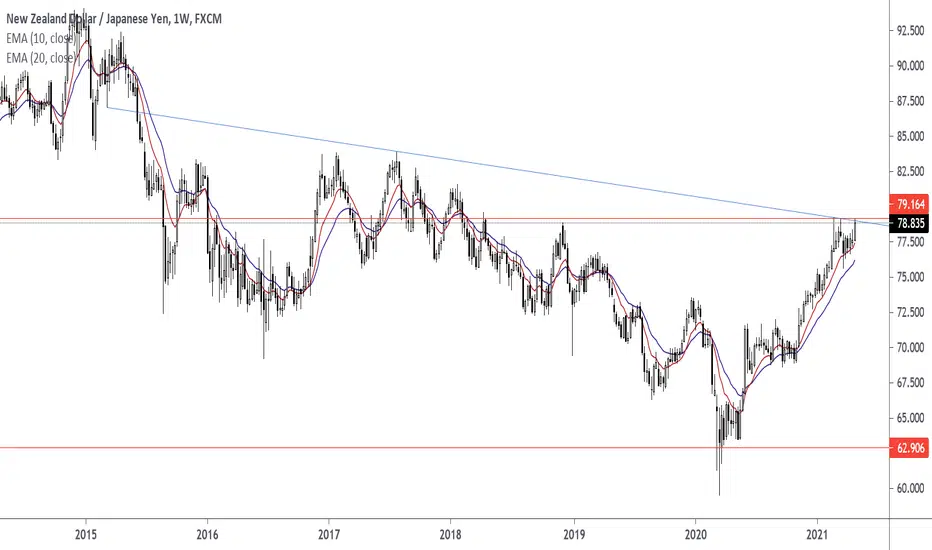
Higher Lows are pushing into trend line resistance. Watch for a breakout at 79.164 and enter using a price action signal.
EMA 10 EMA 20 are pointing up on the Weekly Chart, Daily Chart, and H4 Chart.


EMA 10 EMA 20 are pointing up on the Weekly Chart, Daily Chart, and H4 Chart.
Exención de responsabilidad
La información y las publicaciones que ofrecemos, no implican ni constituyen un asesoramiento financiero, ni de inversión, trading o cualquier otro tipo de consejo o recomendación emitida o respaldada por TradingView. Puede obtener información adicional en las Condiciones de uso.