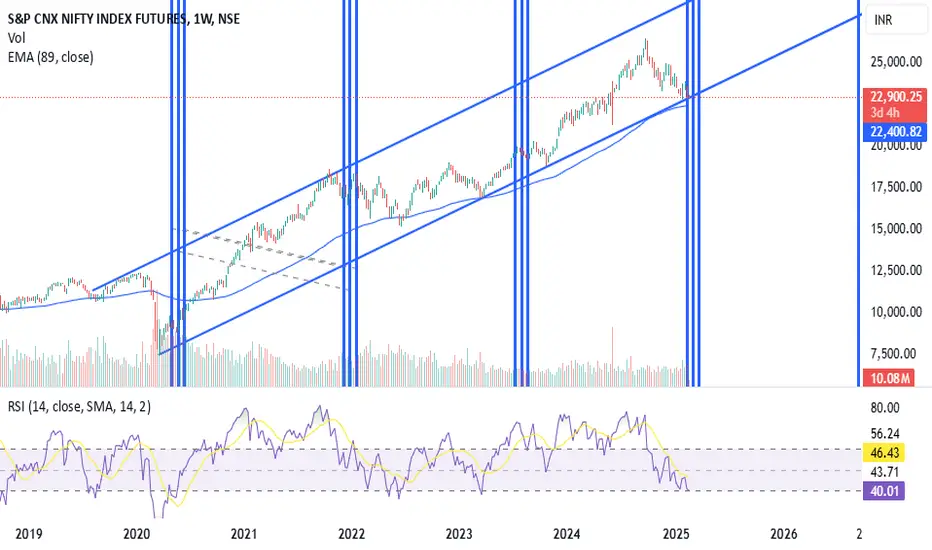
As seen on weekly charts of nifty it has entered a time-cycle zone and multiple supports are in this zone. A trend-line on weekly chart, Weekly moving average, monthly mid of bollinger band or 20 SMA and a bullish time-cycle zone all these supports are in the range of 22200-22800.
A close above a previous day high will show 1st signs of reversal and close above weekly high will confirm the reversal.
Investing partially will be recommended at current levels.
A close above a previous day high will show 1st signs of reversal and close above weekly high will confirm the reversal.
Investing partially will be recommended at current levels.
Exención de responsabilidad
La información y las publicaciones que ofrecemos, no implican ni constituyen un asesoramiento financiero, ni de inversión, trading o cualquier otro tipo de consejo o recomendación emitida o respaldada por TradingView. Puede obtener información adicional en las Condiciones de uso.