📘 NIFTY – TRADING PLAN for 30-May-2025
🕒 Based on 15-minute Chart Analysis
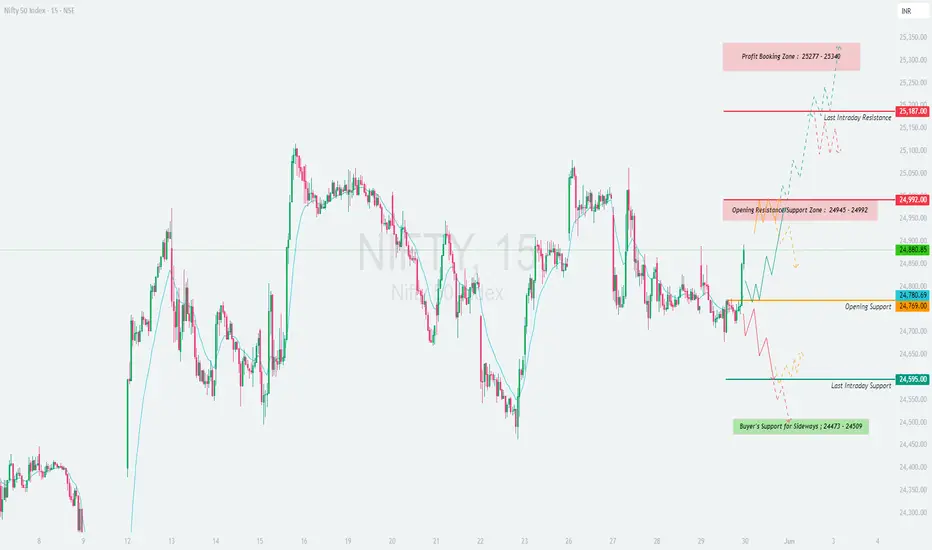
📍 Gap Opening Threshold: 100+ points from previous close of 24,880.85
🕒 Based on 15-minute Chart Analysis
📍 Gap Opening Threshold: 100+ points from previous close of 24,880.85
- 🔼 GAP-UP OPENING (Above 24,992+):
If Nifty opens above the Opening Resistance zone (24,945 – 24,992), it signals potential bullish continuation with strong upward momentum.
✅ Plan of Action:
• Wait for a 15-min candle close above 24,992 for breakout confirmation.
• Once confirmed, long trades may be initiated with upside targets:
→ 25,187 (Last Intraday Resistance)
→ 25,277 – 25,340 (Profit Booking Zone)
• Ideal stop-loss should be just below the breakout candle or beneath the 24,992 zone.
• If Nifty approaches 25,187 too quickly after open, expect minor profit booking or sideways move. Avoid aggressive buying near this resistance without proper structure.
🧠 Educational Insight: A gap-up above resistance is strong only if volume confirms and price sustains. Avoid chasing spikes; instead, wait for retest or consolidation above breakout levels to increase probability of success.
- ⚖️ FLAT OPENING (Between 24,780 – 24,945):
A flat open in this zone keeps the index in a balanced state with both opportunities and risks. Price action will dictate the day’s trend.
✅ Plan of Action:
• Mark the Opening Support: 24,780
• Mark the Resistance Supply zone: 24,945 – 24,992
• Wait for a range breakout:
→ Above 24,992 → Go long (targets: 25,187 → 25,340)
→ Below 24,780 → Go short (targets: 24,595 → 24,473)
• Do not trade within this zone unless price structure is clear and directional.
• Look for rejection wicks or engulfing patterns near support/resistance for potential scalps.
🧠 Educational Insight: Sideways zones are where traders lose most of their capital. Wait for confirmation before jumping in. A “No Trade” decision is also a trade that protects capital.
- 🔽 GAP-DOWN OPENING (Below 24,680):
A gap-down of more than 100 points brings Nifty near key supports: 24,595 (Last Intraday Support) and deeper into Buyer’s Support Zone (24,473 – 24,509).
✅ Plan of Action:
• Observe price behavior near 24,595.
• If this level holds, and you spot bullish reversal signs (hammer, bullish engulfing), go long toward:
→ 24,780 (Opening Support)
→ 24,880 (Previous Close)
• If price breaks below 24,473 with strong bearish candle, it opens up shorting possibilities with deeper targets.
• Stop-loss for reversal longs = below 24,473; for breakdown shorts = above 24,595.
• Avoid trading immediately at open; let the first 15–30 min range develop for clearer direction.
🧠 Educational Insight: Demand zones are highly reactive. Let the market show whether buyers are stepping in or fleeing. React, don’t predict.
🛡 RISK MANAGEMENT TIPS FOR OPTIONS TRADERS:
✅ Always use 15-min confirmation candles before taking a directional position.
✅ Don’t buy far OTM options post-gap openings; use near ATM or spreads to control premium decay.
✅ Define your loss limit for the day and stick to it. One wrong revenge trade can ruin weeks of gains.
✅ Keep position sizing small on volatile or event days — focus on surviving first, thriving later.
✅ Use option spreads like debit spreads to reduce theta exposure during sideways market phases.
📊 SUMMARY & CONCLUSION:
• 🟢 Bullish Scenario: Above 24,992 → Targets: 25,187 / 25,340**
• 🔴 Bearish Scenario: Below 24,595 → Targets: 24,509 / 24,473**
• 🟧 Neutral Zone: 24,780 – 24,945 → Wait for breakout direction
• 🟩 Support Levels: 24,780 / 24,595 / 24,473
• 🟥 Resistance Levels: 24,992 / 25,187 / 25,340
• 🧠 Key Strategy: Avoid emotional trading during volatile opening. Wait, confirm, then act.
✨ Final Word: Trading is a skill of patience and preparation. Let levels guide you, not assumptions. The market rewards precision, not prediction.
📢 DISCLAIMER: I am not a SEBI-registered analyst. This trading plan is intended solely for educational purposes. Please consult your financial advisor before making any trading or investment decisions. Trade wisely. 📉📈
Exención de responsabilidad
The information and publications are not meant to be, and do not constitute, financial, investment, trading, or other types of advice or recommendations supplied or endorsed by TradingView. Read more in the Terms of Use.
Exención de responsabilidad
The information and publications are not meant to be, and do not constitute, financial, investment, trading, or other types of advice or recommendations supplied or endorsed by TradingView. Read more in the Terms of Use.