📊 NIFTY Trading Plan for 12-May-2025 (15-min Chart)
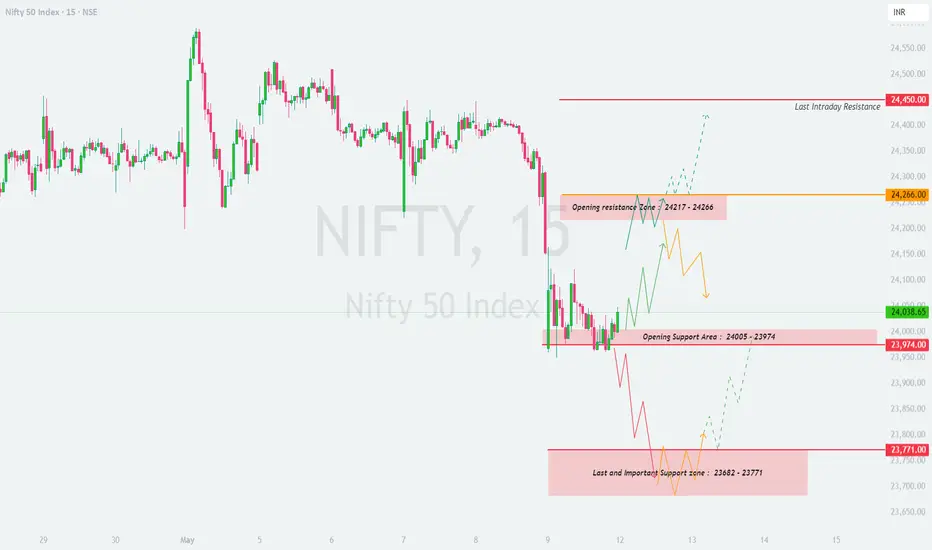
We’re currently trading near the 24,038 level. The chart suggests clearly defined support and resistance zones which will guide our trading actions depending on the opening. Remember: we define a gap opening as 100+ points away from the previous close.
🟢 SCENARIO 1: Gap-Up Opening (Above 24,266)
If Nifty opens with a gap-up above the Opening Resistance Zone (24,217 – 24,266) and sustains above it:
However, if price opens above but slips back below 24,217, it might indicate a false breakout. In that case, wait for confirmation before taking aggressive trades.
🟨 SCENARIO 2: Flat Opening (Between 24,038 and 24,100)
A flat opening would place us within the current trading range. This is a zone of indecision, so patience is key.
Wait at least 15–30 mins post-opening for direction clarity. Let the market show its hand.
🔻 SCENARIO 3: Gap-Down Opening (Below 23,900)
This could lead to a test of the Last Support Zone: 23,682 – 23,771. This zone is crucial.
Be cautious on put side here unless breakdown sustains – whipsaws are common near strong supports.
📘 Risk Management Tips for Options Traders 🧠
📌 Summary & Conclusion:
Key Levels to Watch: 👀
🔸 Opening Resistance Zone: 24,217 – 24,266
🔸 Opening Support Zone: 24,005 – 23,974
🔸 Major Support Area: 23,682 – 23,771
🔸 Upside Resistance: 24,450
This is a day to let the market settle in early trades. Direction will be determined by breakout or breakdown from the marked zones. Don’t chase; instead react to the market’s structure with discipline.
⚠️ Disclaimer:
I am not a SEBI-registered analyst. All views shared here are for educational purposes only. Please consult your financial advisor before taking any position. Trade at your own risk.
We’re currently trading near the 24,038 level. The chart suggests clearly defined support and resistance zones which will guide our trading actions depending on the opening. Remember: we define a gap opening as 100+ points away from the previous close.
🟢 SCENARIO 1: Gap-Up Opening (Above 24,266)
If Nifty opens with a gap-up above the Opening Resistance Zone (24,217 – 24,266) and sustains above it:
- []Watch for price action near 24,266 – if it holds, bulls might push toward the last intraday resistance of 24,450.
[]Ideal entry: On retest of 24,266 with a strong bullish candle.
[]Targets: 🎯 24,375 – 24,450[]Stop Loss: 🔻 Below 24,200 on an hourly candle close.
However, if price opens above but slips back below 24,217, it might indicate a false breakout. In that case, wait for confirmation before taking aggressive trades.
🟨 SCENARIO 2: Flat Opening (Between 24,038 and 24,100)
A flat opening would place us within the current trading range. This is a zone of indecision, so patience is key.
- []Observe how price reacts near the Opening Resistance Zone (24,217 – 24,266) and Opening Support Zone (24,005 – 23,974).
[]Bullish bias above 24,100 with confirmation candle targeting 24,217 and eventually 24,266.
[]Bearish bias only below 23,974 – look for breakdown and confirmation for short opportunities.
[]Avoid trades within this tight zone until a breakout or breakdown happens with volume.
Wait at least 15–30 mins post-opening for direction clarity. Let the market show its hand.
🔻 SCENARIO 3: Gap-Down Opening (Below 23,900)
This could lead to a test of the Last Support Zone: 23,682 – 23,771. This zone is crucial.
- []If the index opens below 23,900 and heads toward 23,771–23,682, expect demand from this support.
[]Look for bullish reversal candles in this zone for a possible intraday bounce.
[]If breakdown happens below 23,682 with volume and a 15-min close, market could slide further towards 23,550–23,450 levels.
[]Avoid catching falling knives. Wait for confirmation (hammer, bullish engulfing).
Be cautious on put side here unless breakdown sustains – whipsaws are common near strong supports.
📘 Risk Management Tips for Options Traders 🧠
- []Avoid buying deep OTM options. Stick to ATM or slightly ITM contracts for better delta and lower decay.
[]Always define your risk with stop-loss based on candle closes (ideally 15 or 1-hour).
[]Don’t trade just on gap logic. Wait for the price to respect or reject key levels.
[]Trail your profits instead of aiming for unrealistic targets. Consistency > Jackpot. - Position sizing is key. Never risk more than 1–2% of your capital on a single trade.
📌 Summary & Conclusion:
Key Levels to Watch: 👀
🔸 Opening Resistance Zone: 24,217 – 24,266
🔸 Opening Support Zone: 24,005 – 23,974
🔸 Major Support Area: 23,682 – 23,771
🔸 Upside Resistance: 24,450
This is a day to let the market settle in early trades. Direction will be determined by breakout or breakdown from the marked zones. Don’t chase; instead react to the market’s structure with discipline.
⚠️ Disclaimer:
I am not a SEBI-registered analyst. All views shared here are for educational purposes only. Please consult your financial advisor before taking any position. Trade at your own risk.
Exención de responsabilidad
La información y las publicaciones no constituyen, ni deben considerarse como asesoramiento o recomendaciones financieras, de inversión, de trading o de otro tipo proporcionadas o respaldadas por TradingView. Más información en Condiciones de uso.
Exención de responsabilidad
La información y las publicaciones no constituyen, ni deben considerarse como asesoramiento o recomendaciones financieras, de inversión, de trading o de otro tipo proporcionadas o respaldadas por TradingView. Más información en Condiciones de uso.