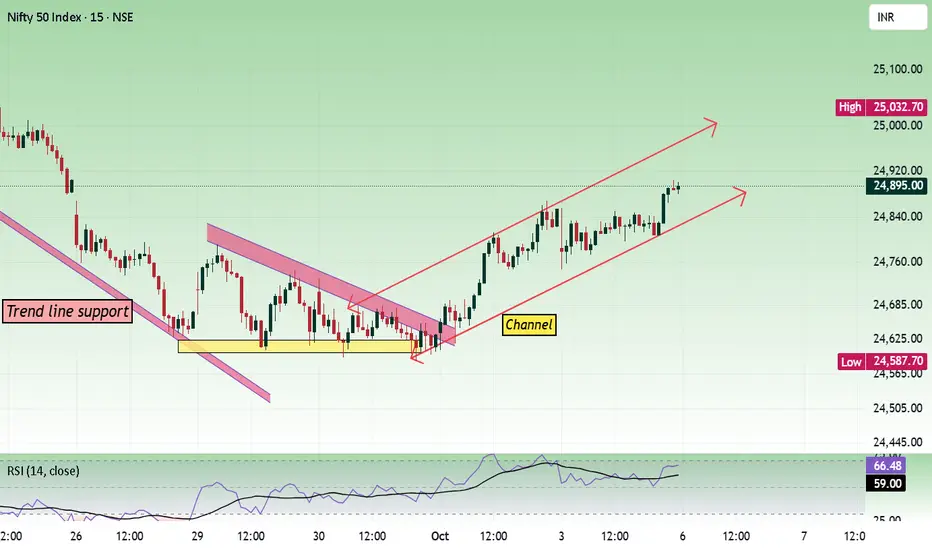
In a lower time frame, the price is moving within an ascending channel. Channel movement requires more patience to identify trade setups and execute them. In the daily time frame, the price is taking a trendline support.

Nearby resistance is seen at the 25000 zone.
Buy above 24920 with the stop loss of 24860 for the targets 24960, 25000, 25040, 25100, 25160, 25220, and 25280.
Sell below 24760 with the stop loss of 24820 for the targets 24720, 24660, 24600, 24560, and 24520.
Always do your analysis before taking any trade.
Operación activa
Nearing upper channel. Role I play here : Moderator. Follow me in telegram to trade better. t.me/Analysis4Newbie Contact information : tradingplan4u@gmail.com
Exención de responsabilidad
La información y las publicaciones que ofrecemos, no implican ni constituyen un asesoramiento financiero, ni de inversión, trading o cualquier otro tipo de consejo o recomendación emitida o respaldada por TradingView. Puede obtener información adicional en las Condiciones de uso.
Role I play here : Moderator. Follow me in telegram to trade better. t.me/Analysis4Newbie Contact information : tradingplan4u@gmail.com
Exención de responsabilidad
La información y las publicaciones que ofrecemos, no implican ni constituyen un asesoramiento financiero, ni de inversión, trading o cualquier otro tipo de consejo o recomendación emitida o respaldada por TradingView. Puede obtener información adicional en las Condiciones de uso.