📅 NIFTY Trading Plan – 21st May 2025
🕘 Timeframe: 15-Minute | 🧠 Approach: Structure + Reaction Zones + Momentum Psychology
📊 Key Price Zones to Watch:
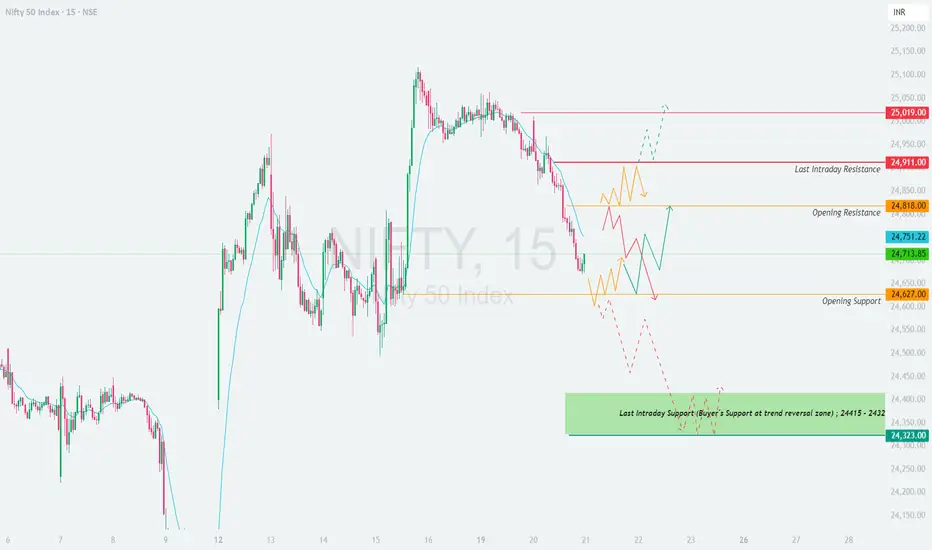
🔴 Last Intraday Resistance: 24,911
🔺 Breakout Resistance: 25,019
🟠 Opening Resistance: 24,818
🟢 Opening Support: 24,627
🟩 Buyer’s Demand Zone: 24,415 – 24,432
🧱 Critical Demand Base: 24,323
📈 Scenario 1: GAP UP Opening (🔼 100+ points) – Opening Above 24,818
If Nifty opens directly above the Opening Resistance of 24,818 due to a bullish gap-up, it enters a low-volume zone that could push prices toward 24,911 and even 25,019.
📌 Educational Note: Gap-ups often trap emotional buyers. Look for signs of sustainability before entering. If candles show exhaustion or long upper wicks, it's a red flag.
⚖️ Scenario 2: FLAT Opening (±100 points) – Between 24,627 to 24,818
A flat opening gives both bulls and bears room to maneuver, making it the most flexible condition to work with structure-based plans.
📌 Educational Note: Flat opens are all about who dominates first. Let the market decide. Don’t be early; price action is your teacher — not your ego.
📉 Scenario 3: GAP DOWN Opening (🔽 100+ points) – Opening Below 24,627
A gap-down opens doors to panic-selling but also offers opportunity if the demand zone absorbs pressure.
📌 Educational Note: Panic gaps test emotional discipline. Don't assume rebounds—wait for confirmation. It's okay to miss the first move and catch the trend later.
🛡️ Options Trading – Risk Management Tips:
✅ Avoid Far OTM Buying: Unless you see trending moves, far OTM options will decay quickly.
✅ Use Defined-Risk Spreads: Prefer Bull Call or Bear Put Spreads on breakout/breakdown confirmations.
✅ Keep SL Fixed in % Terms: Suggested: 30–40% SL of premium for option buyers.
✅ Use the Opening Candle High/Low: As SL reference for naked option positions.
✅ Avoid Overnight Carry: Especially for naked options—risk can be unlimited.
✅ Reassess After 2 Failed Trades: Market might be rangebound or volatile beyond logic.
📌 Summary & Conclusion:
🔼 Above 24,911: Momentum bullish → Target 25,019
🔄 Between 24,627 – 24,818: Neutral zone → Let structure form
🔽 Below 24,627: Weakness → Test of 24,432 → 24,323 possible
📌 Core Principle: Let the market confirm your bias. Be a sniper, not a machine gunner. Clear structure = clear edge.
📢 Disclaimer:
I am not a SEBI-registered analyst. This content is purely for educational and informational purposes[/b
🕘 Timeframe: 15-Minute | 🧠 Approach: Structure + Reaction Zones + Momentum Psychology
📊 Key Price Zones to Watch:
🔴 Last Intraday Resistance: 24,911
🔺 Breakout Resistance: 25,019
🟠 Opening Resistance: 24,818
🟢 Opening Support: 24,627
🟩 Buyer’s Demand Zone: 24,415 – 24,432
🧱 Critical Demand Base: 24,323
📈 Scenario 1: GAP UP Opening (🔼 100+ points) – Opening Above 24,818
If Nifty opens directly above the Opening Resistance of 24,818 due to a bullish gap-up, it enters a low-volume zone that could push prices toward 24,911 and even 25,019.
- []Do NOT chase long entries blindly post gap-up. First 15–30 minutes will decide the strength of bulls.
[]If a strong 15-minute candle closes above 24,911, a potential breakout to 25,019 may play out.
[]Only enter long trades if price holds above 24,911 with good volume.
[]If price faces rejection at 24,911, short-term reversal trades back to 24,818 → 24,750 are possible. - Avoid overtrading above 25,019; it’s uncharted territory and momentum may fade quickly.
📌 Educational Note: Gap-ups often trap emotional buyers. Look for signs of sustainability before entering. If candles show exhaustion or long upper wicks, it's a red flag.
⚖️ Scenario 2: FLAT Opening (±100 points) – Between 24,627 to 24,818
A flat opening gives both bulls and bears room to maneuver, making it the most flexible condition to work with structure-based plans.
- []If price sustains above 24,750–24,760 (the pivot area), buyers may push toward 24,818 → 24,911.
[]Clear bullish strength beyond 24,911 can target 25,019, but only after volume confirmation.
[]On the flip side, if price breaks below 24,627, short trades toward the Demand Zone: 24,415–24,432 become active.
[]Wait for bearish structure (e.g., breakdown + retest rejection) to confirm shorts. - Use the opening 15-minute candle high/low as your first trigger range for bias.
📌 Educational Note: Flat opens are all about who dominates first. Let the market decide. Don’t be early; price action is your teacher — not your ego.
📉 Scenario 3: GAP DOWN Opening (🔽 100+ points) – Opening Below 24,627
A gap-down opens doors to panic-selling but also offers opportunity if the demand zone absorbs pressure.
- []If price opens around 24,550–24,600 and forms a base, a bounce toward 24,627 → 24,750 is highly probable.
[]However, if price immediately slides into 24,415–24,432 (buyer zone), watch for reversal patterns like hammer, bullish engulfing, or double bottom.
[]If breakdown occurs below 24,415, then 24,323 becomes the final lifeline. A close below this may trigger sharp intraday sell-offs.
[]Only short if 15-min candle closes below 24,415 and fails retest.
📌 Educational Note: Panic gaps test emotional discipline. Don't assume rebounds—wait for confirmation. It's okay to miss the first move and catch the trend later.
🛡️ Options Trading – Risk Management Tips:
✅ Avoid Far OTM Buying: Unless you see trending moves, far OTM options will decay quickly.
✅ Use Defined-Risk Spreads: Prefer Bull Call or Bear Put Spreads on breakout/breakdown confirmations.
✅ Keep SL Fixed in % Terms: Suggested: 30–40% SL of premium for option buyers.
✅ Use the Opening Candle High/Low: As SL reference for naked option positions.
✅ Avoid Overnight Carry: Especially for naked options—risk can be unlimited.
✅ Reassess After 2 Failed Trades: Market might be rangebound or volatile beyond logic.
📌 Summary & Conclusion:
🔼 Above 24,911: Momentum bullish → Target 25,019
🔄 Between 24,627 – 24,818: Neutral zone → Let structure form
🔽 Below 24,627: Weakness → Test of 24,432 → 24,323 possible
📌 Core Principle: Let the market confirm your bias. Be a sniper, not a machine gunner. Clear structure = clear edge.
📢 Disclaimer:
I am not a SEBI-registered analyst. This content is purely for educational and informational purposes[/b
Exención de responsabilidad
La información y las publicaciones que ofrecemos, no implican ni constituyen un asesoramiento financiero, ni de inversión, trading o cualquier otro tipo de consejo o recomendación emitida o respaldada por TradingView. Puede obtener información adicional en las Condiciones de uso.