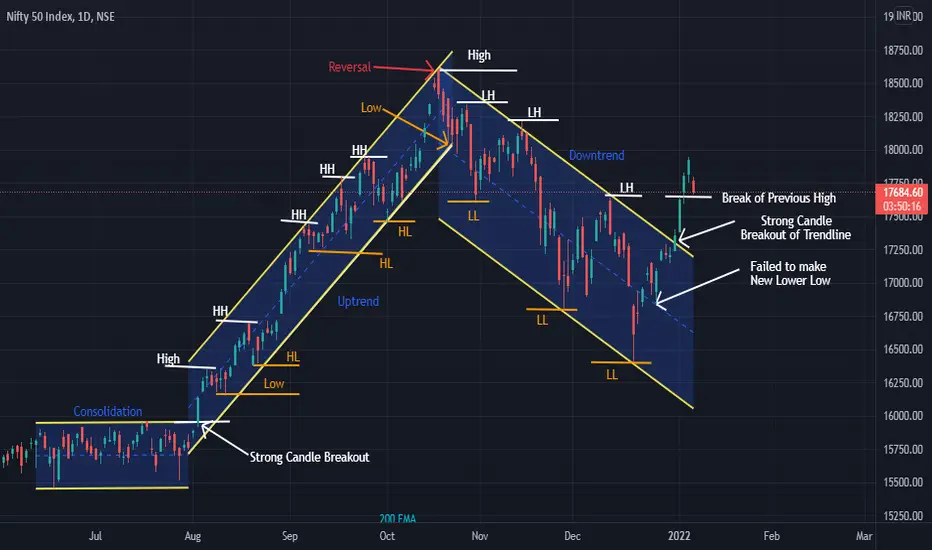
Beautiful Example of Price Action shown by Nifty on Daily chart.
First you can see Consolidation before BULL run.
When BULL run started you can see HH & HL forming in Uptrend Channel
once it reaches the Top it showed Reversal with Continuous red candles
After that a Downtrend with HL & LL forming
and it broke the channel upside - Showing Breakout of Resistance Line
Understanding Simple Price Action in one Chart Shown by Nifty
please do correlate by yourself also on charts. This is for educational and paper trading purpose only. Please consult your financial advisor before invest
Exención de responsabilidad
La información y las publicaciones que ofrecemos, no implican ni constituyen un asesoramiento financiero, ni de inversión, trading o cualquier otro tipo de consejo o recomendación emitida o respaldada por TradingView. Puede obtener información adicional en las Condiciones de uso.