🔹 NIFTY Trading Plan for 05-Nov-2025
(Based on psychological correction theory & intraday structural behavior)
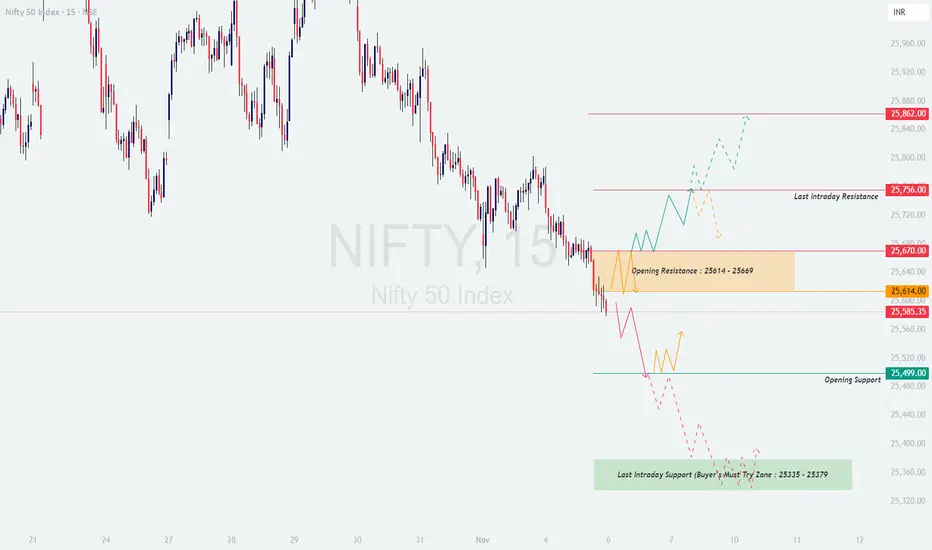
Chart Reference Levels:
🟧 Opening Resistance Zone: 25,614 – 25,669
🟥 Last Intraday Resistance: 25,756
🟩 Opening Support: 25,499
🟢 Last Intraday Support (Buyers’ Must-Try Zone): 25,335 – 25,379
❤️ Upside Extension: 25,862
🟢 Scenario 1: Gap-Up Opening (100+ points above previous close)
📘 Educational Note: Gap-up openings are often emotional reactions to overnight cues. Let the market confirm strength before chasing momentum. Look for stability above key resistance levels before taking directional calls.
🟠 Scenario 2: Flat Opening (±50 points around 25,585)
📘 Educational Note: Flat openings provide the cleanest opportunities for structured intraday setups. Patience during the first 30 minutes helps identify whether smart money is accumulating (bullish bias) or distributing (bearish bias).
🔴 Scenario 3: Gap-Down Opening (100+ points below previous close)
📘 Educational Note: Gap-downs often start with fear-driven selling. Smart traders wait for confirmation candles before entering, as the first impulse frequently fades when institutional players absorb liquidity at lower levels.
💡 Risk Management Tips for Options Traders
📊 Summary & Conclusion:
In summary, 05-Nov-2025 looks like a crucial reaction day — buyers must defend supports, while sellers may try to push the market lower. The best approach is to stay patient for the first half-hour, identify structure, and trade based on confirmation, not assumptions.
⚠️ Disclaimer:
I am not a SEBI-registered analyst. The analysis above is purely for educational and informational purposes. Traders are advised to do their own research or consult a certified financial advisor before making any trading decisions.
(Based on psychological correction theory & intraday structural behavior)
Chart Reference Levels:
🟧 Opening Resistance Zone: 25,614 – 25,669
🟥 Last Intraday Resistance: 25,756
🟩 Opening Support: 25,499
🟢 Last Intraday Support (Buyers’ Must-Try Zone): 25,335 – 25,379
❤️ Upside Extension: 25,862
🟢 Scenario 1: Gap-Up Opening (100+ points above previous close)
- [] If Nifty opens around or above 25,670, it will directly test the Opening Resistance Zone (25,614 – 25,669). Here, traders should observe how the market reacts — a rejection with long upper wicks or high volatility candles could indicate distribution.
[] For bullish continuation, Nifty must sustain above 25,669 with a decisive 15-min candle close. A breakout can invite fresh momentum, pushing the index toward 25,756 and possibly extending up to 25,862. - Failure to hold above 25,669 may trigger a quick pullback to 25,614 or even back to the Opening Support at 25,499, where intraday buyers might reattempt to defend.
📘 Educational Note: Gap-up openings are often emotional reactions to overnight cues. Let the market confirm strength before chasing momentum. Look for stability above key resistance levels before taking directional calls.
🟠 Scenario 2: Flat Opening (±50 points around 25,585)
- [] A flat open near the current zone (25,560–25,600) keeps Nifty in a balancing phase between bulls and bears. This range can act as a decision-making area for the day.
[] Sustained price action above 25,614 will likely attract buying interest, taking prices toward 25,669 – 25,756 levels. - On the downside, if Nifty slips below 25,499, selling pressure can intensify, dragging the index toward 25,379, which is the “Buyers’ Must-Try Zone.”
📘 Educational Note: Flat openings provide the cleanest opportunities for structured intraday setups. Patience during the first 30 minutes helps identify whether smart money is accumulating (bullish bias) or distributing (bearish bias).
🔴 Scenario 3: Gap-Down Opening (100+ points below previous close)
- [] A gap-down below 25,500 directly places the index near the Opening Support or Last Intraday Support zone (25,335 – 25,379).
[] Watch this area carefully — if buyers fail to defend, weakness can extend further. However, a strong reversal candle or volume divergence could trigger short-covering opportunities. - Recovery back above 25,499 would indicate that buyers are attempting to regain control. In that case, a bounce toward 25,614 may unfold, where traders can re-evaluate the next move.
📘 Educational Note: Gap-downs often start with fear-driven selling. Smart traders wait for confirmation candles before entering, as the first impulse frequently fades when institutional players absorb liquidity at lower levels.
💡 Risk Management Tips for Options Traders
- [] Define your maximum risk per trade (1–2% of capital) before entry.
[] Use hourly candle close-based stop losses to avoid false triggers from volatility spikes.
[] Avoid buying far OTM options post 11:00 AM; time decay accelerates rapidly.
[] If volatility (IV) is elevated, consider vertical spreads instead of naked calls or puts. - Always plan both entry and exit before executing — emotions should not decide your stop loss.
📊 Summary & Conclusion:
- [] Above 25,669 → Bullish momentum possible toward 25,756 – 25,862.
[] Between 25,499 – 25,614 → Neutral consolidation; intraday reactions will decide direction. - Below 25,499 → Weakness likely toward 25,379 and 25,335 zones.
In summary, 05-Nov-2025 looks like a crucial reaction day — buyers must defend supports, while sellers may try to push the market lower. The best approach is to stay patient for the first half-hour, identify structure, and trade based on confirmation, not assumptions.
⚠️ Disclaimer:
I am not a SEBI-registered analyst. The analysis above is purely for educational and informational purposes. Traders are advised to do their own research or consult a certified financial advisor before making any trading decisions.
Operación cerrada: objetivo alcanzado
Exención de responsabilidad
La información y las publicaciones que ofrecemos, no implican ni constituyen un asesoramiento financiero, ni de inversión, trading o cualquier otro tipo de consejo o recomendación emitida o respaldada por TradingView. Puede obtener información adicional en las Condiciones de uso.