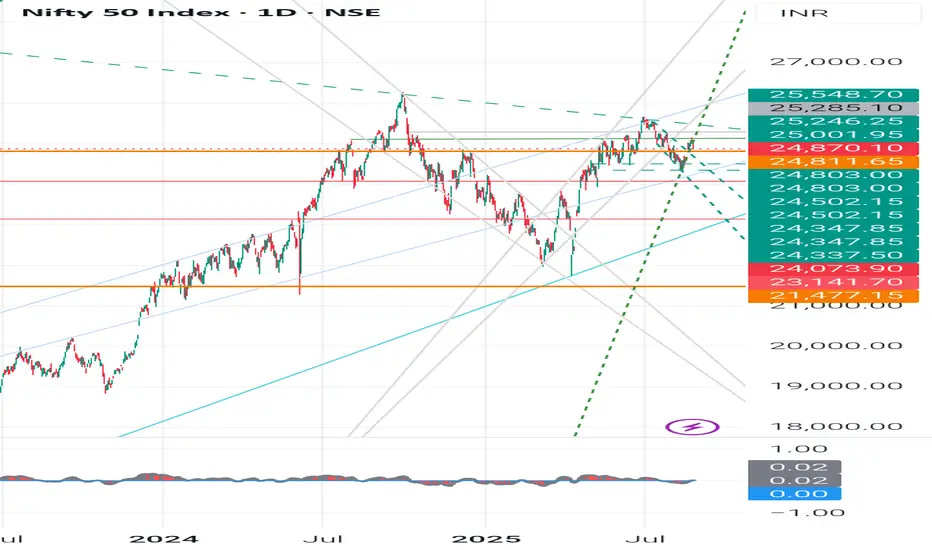
Nifty 50 - Technical Chart Analysis (as per Daily chart)
Current Price (CMP): 25,070
Trend: Sideways consolidation between 24,500 - 25,500 levels.
Chart Pattern:
Multiple tests of 25,500 - strong resistance.
Multiple supports around 24,500 - 24,800 - strong demand zone.
The broad pattern looks like a Rectangle / Range-bound movement.
Swing Analysis:
Higher swing lows visible after 24,000 - bullish undertone.
Lower swing highs at 25,500 - supply pressure.
Key Levels
- Immediate Resistance: 25,250 - 25,550 - 26,000
- Immediate Support: 24,800 - 24,500 - 24,073
Major Support: 23,141 - 21,477 (long-term trend support)
👉Candlestick Learnings (Recent Pattern)
Recent candles show long wicks both sides - market indecision (buyers & sellers fighting).
A strong green bullish engulfing candle near 24,500 support - sign of buyers stepping in.
Current candles forming inside bars - breakout move expected soon (either above 25,500 or below 24,500).
✍️Student Learning Point:
When candles show long wicks near support - it signals accumulation.
When candles cluster near resistance - expect breakout/reversal.
Always confirm with volume before taking position.
Fundamental Comparison - Nifty Competitors (Index Peers)
Since Nifty 50 is an index, let’s compare with other global indices (macro investing perspective):
Index P/E Ratio Dividend Yield 5Y CAGR Returns Volatility
Nifty 50 -22-23 -1.2% -13% Moderate
Sensex -24 -1.1% -12% Moderate
Dow Jones -21 -1.7% -9% Lower
Nasdaq 100 -28 -0.9% -15% High
Shanghai Comp -17 -2.0% -5% Moderate
Learnings:
Nifty has a healthy P/E (not cheap, not too expensive).
Growth rate is higher than global averages - India is attractive long-term.
Volatility is moderate, making Nifty good for SIP investors & long-term compounding.
Investment Learnings for Students
1. Candlestick Patterns: Learn basics like Doji, Engulfing, Hammer, Shooting Star - they often show reversal/continuation.
2. Swing Analysis: Markets move in swings (higher highs/lows in uptrend, lower highs/lows in downtrend). Recognizing them helps in entry/exit.
3. Support & Resistance: Always mark key levels before trading/investing.
4. Fundamentals: Don’t just look at charts - check P/E, dividend yield, EPS growth, sector weightage.
5. Risk Management: Use stop-loss in trading. For investing, use SIP & diversify.
⚠️ Disclaimer
This analysis is for educational purposes only. Not a SEBI-registered advisory. Students & investors should do their own research or consult a financial advisor before making decisions.
#Nifty50 #StockMarketIndia #TechnicalAnalysis #InvestingForBeginners #CandlestickPatterns #SwingTrading #SupportAndResistance #StockMarketEducation #MarketLearning
Publicaciones relacionadas
Exención de responsabilidad
La información y las publicaciones no constituyen, ni deben considerarse como asesoramiento o recomendaciones financieras, de inversión, de trading o de otro tipo proporcionadas o respaldadas por TradingView. Más información en Condiciones de uso.