📈 NIFTY TRADING PLAN – 13th May 2025 (15-Min Chart Analysis)
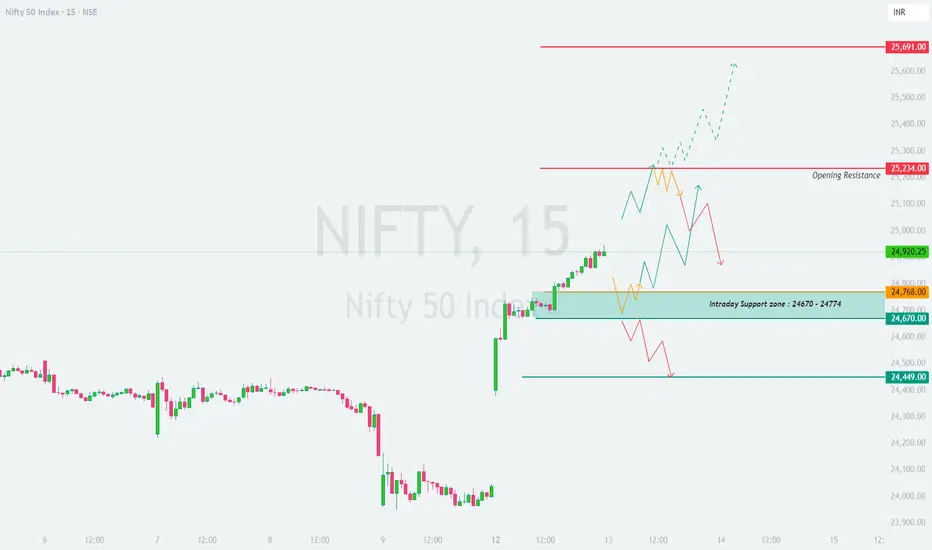
Nifty closed at 24,920 on 12-May-2025. The recent structure shows a sharp bullish move with resistance forming near 25,234 and support around 24,670–24,768.
The market is currently at a decision point, and the next move will depend heavily on where it opens. Below is a breakdown for each type of opening with actionable trade plans.
🟢 SCENARIO 1: GAP-UP OPENING (Opening Above 25,020)
(Gap up of 100+ points from previous close)
- []A gap-up above 25,020 places Nifty near the Opening Resistance zone at 25,234. This is a crucial level that must be watched for either rejection or breakout.
[]If the index opens between 25,020 and 25,234, wait and observe the first 15–30 minutes. Avoid jumping into a trade unless a clear bullish structure is formed.
[]A breakout and sustained move above 25,234 with strong candles can trigger a rally toward 25,691. In such a case, long trades can be initiated with SL below 25,180.
[]If price shows signs of rejection (wicks, bearish engulfing) near 25,234, aggressive traders can look for a reversal trade with targets around 24,920 – 24,768. - Avoid initiating trades at the opening candle in this zone — wait for follow-through confirmation.
👉 Educational Insight: Gap-ups near resistance zones often trap early buyers. Let the market confirm direction before committing.
🟨 SCENARIO 2: FLAT OPENING (Between 24,820 – 25,020)
(Open within previous close ±100 pts)- []Flat openings inside the current range should be treated cautiously. Price is already in an indecisive zone.
[]Watch price behavior near 24,920 (previous close). If the index builds higher lows and breaks 25,020 with strength, it may attempt to test 25,234.
[]On the downside, if the structure weakens and slips below 24,820, we can see a dip toward the Intraday Support Zone of 24,670–24,768.
[]Only trade breakout above 25,020 or breakdown below 24,768 with structure confirmation. This avoids getting trapped in sideways moves. - Avoid trades in tight 30–40 point ranges — these tend to chop traders with frequent reversals.
👉 Educational Insight: During flat opens, it’s best to let the initial price range form before making directional bets. Often, first 30–45 mins help define the day’s range.
🔻 SCENARIO 3: GAP-DOWN OPENING (Below 24,820)
(Gap down of 100+ points from previous close)- []If Nifty opens below 24,820, it will test the Intraday Support zone of 24,670 – 24,768. This zone may offer a technical bounce.
[]Look for bullish reversal candles (hammer, morning star, bullish engulfing) in this zone. If seen, consider a long trade with target toward 24,920 and SL below 24,650.
[]If this support zone breaks, and price sustains below 24,670, expect further downside toward 24,449.
[]In case of a breakdown below 24,670 followed by a retest and rejection from below, one may go short for intraday targets. - Avoid knife-catching on gap-downs. Let market absorb selling pressure first — wait for exhaustion or structure to form.
👉 Educational Insight: In gap-down scenarios, panic can create exaggerated moves. Patience and confirmation-based entries are key for safety.
🧠 RISK MANAGEMENT & OPTIONS TRADING TIPS:- []Trade ATM or slightly ITM options to manage decay and increase responsiveness.
[]Never buy deep OTM options unless a very strong trending day is expected.
[]Use underlying index levels to define stop-loss — not just premium.
[]Keep maximum 2% of your capital at risk per trade.
[]Set alerts at key levels like 25,234, 24,768, and 24,670 to stay ahead of triggers.
[]Avoid overtrading. 1–2 good trades a day are more than enough. - Use a trailing SL once in profit zone to protect gains.
🔸 Resistance Levels: 25,234 and 25,691
🔸 Support Zone: 24,670 – 24,768
🔸 Breakout Zone: Above 25,234
🔸 Breakdown Zone: Below 24,670
🔸 No Trade Zone: 24,820 – 25,020 (until clear move)
🧭 The market is currently resting just below a resistance zone. Confirmation-based breakout or pullback setups around key zones will offer the best opportunities. Don’t anticipate direction — let the market tell you.
⚠️ DISCLAIMER:
I am not a SEBI-registered analyst. The above trading plan is shared solely for educational purposes. Always consult a registered financial advisor before taking any trading or investment decision. Trade at your own risk with proper analysis and risk control. - []Trade ATM or slightly ITM options to manage decay and increase responsiveness.
- []If Nifty opens below 24,820, it will test the Intraday Support zone of 24,670 – 24,768. This zone may offer a technical bounce.
- []Flat openings inside the current range should be treated cautiously. Price is already in an indecisive zone.
Exención de responsabilidad
La información y las publicaciones no constituyen, ni deben considerarse como asesoramiento o recomendaciones financieras, de inversión, de trading o de otro tipo proporcionadas o respaldadas por TradingView. Más información en Condiciones de uso.
Exención de responsabilidad
La información y las publicaciones no constituyen, ni deben considerarse como asesoramiento o recomendaciones financieras, de inversión, de trading o de otro tipo proporcionadas o respaldadas por TradingView. Más información en Condiciones de uso.