Index: Nifty 50
Timeframe: 15-minute
Date: 21st May 2025
Price Action Insight
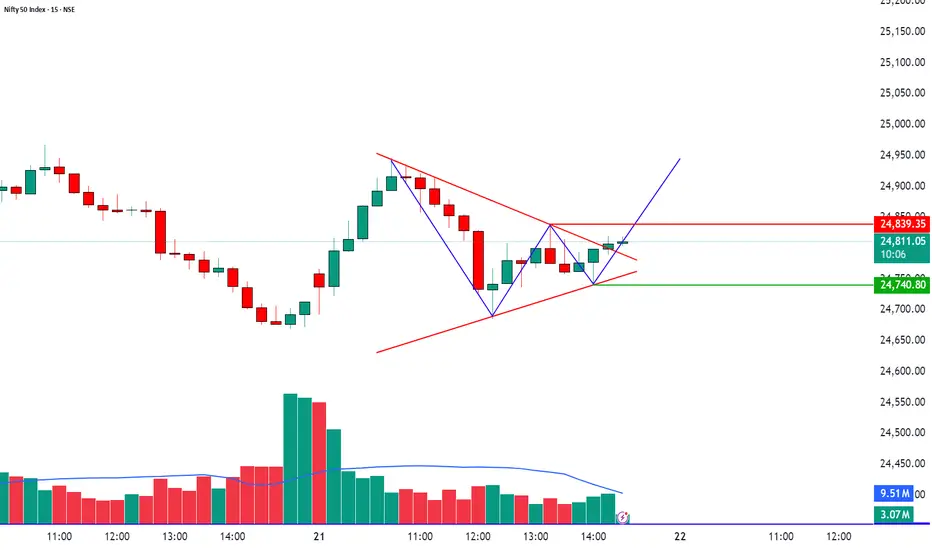
After a strong sell-off, NIFTY 50 formed a solid V-shaped recovery, followed by a series of higher lows, indicating a shift in momentum from sellers to buyers. Price is now consolidating near a key resistance level at 24,839.35, suggesting a potential breakout or rejection setup.
Chart Patterns in Focus
Falling Wedge (Bullish Reversal)
Breakout occurred after price compressed into the wedge.
A textbook reversal pattern signaling buying interest returning.
Bullish Flag / Pennant Formation
Post-wedge breakout, price is consolidating in a narrow range (flag).
Typically seen as a continuation pattern before another bullish leg.
Trendline Support
Price is holding above an ascending trendline, forming higher lows, reinforcing bullish bias.
Volume Analysis
Volume spiked during the wedge breakout – confirming buyer participation.
Current consolidation shows declining volume, indicating a possible volume expansion ahead.
Watch for a volume surge during breakout or breakdown for trade confirmation.
Educational Insight: How to Read This Setup
Why this matters for traders:
A falling wedge + bullish flag is a high-conviction combo.
Volume contraction during consolidation is healthy and often precedes explosive moves.
Price rejecting or sustaining above resistance gives traders directional edge.
Always wait for confirmation with price action + volume to avoid fakeouts.
Trade Scenarios
✅ Bullish Scenario (Long Trade)
Entry: Above 24,839.35
Target Zones: 24,900 / 24,950
Stop-Loss: Below 24,740.80 (below consolidation and trendline support)
Confirmation: Breakout candle with above-average volume
❌ Bearish Scenario (Short Trade)
Entry: Below 24,740.80
Target Zones: 24,650 / 24,580
Stop-Loss: Above 24,839.35
Confirmation: Breakdown from trendline support + rise in selling volume
Timeframe: 15-minute
Date: 21st May 2025
Price Action Insight
After a strong sell-off, NIFTY 50 formed a solid V-shaped recovery, followed by a series of higher lows, indicating a shift in momentum from sellers to buyers. Price is now consolidating near a key resistance level at 24,839.35, suggesting a potential breakout or rejection setup.
Chart Patterns in Focus
Falling Wedge (Bullish Reversal)
Breakout occurred after price compressed into the wedge.
A textbook reversal pattern signaling buying interest returning.
Bullish Flag / Pennant Formation
Post-wedge breakout, price is consolidating in a narrow range (flag).
Typically seen as a continuation pattern before another bullish leg.
Trendline Support
Price is holding above an ascending trendline, forming higher lows, reinforcing bullish bias.
Volume Analysis
Volume spiked during the wedge breakout – confirming buyer participation.
Current consolidation shows declining volume, indicating a possible volume expansion ahead.
Watch for a volume surge during breakout or breakdown for trade confirmation.
Educational Insight: How to Read This Setup
Why this matters for traders:
A falling wedge + bullish flag is a high-conviction combo.
Volume contraction during consolidation is healthy and often precedes explosive moves.
Price rejecting or sustaining above resistance gives traders directional edge.
Always wait for confirmation with price action + volume to avoid fakeouts.
Trade Scenarios
✅ Bullish Scenario (Long Trade)
Entry: Above 24,839.35
Target Zones: 24,900 / 24,950
Stop-Loss: Below 24,740.80 (below consolidation and trendline support)
Confirmation: Breakout candle with above-average volume
❌ Bearish Scenario (Short Trade)
Entry: Below 24,740.80
Target Zones: 24,650 / 24,580
Stop-Loss: Above 24,839.35
Confirmation: Breakdown from trendline support + rise in selling volume
Operación cerrada manualmente
Target Zones: 24,650 / 24,580 reachedSTWP | Mentor & Demand-Supply Specialist | Empowering traders through structured learning |
simpletradewithpatience.com
Community: chat.whatsapp.com/BEYz0tkqP0fJPBCWf59uel
wa.me/message/6IOPHGOXMGZ4N1
Educational Only
simpletradewithpatience.com
Community: chat.whatsapp.com/BEYz0tkqP0fJPBCWf59uel
wa.me/message/6IOPHGOXMGZ4N1
Educational Only
Exención de responsabilidad
La información y las publicaciones no constituyen, ni deben considerarse como asesoramiento o recomendaciones financieras, de inversión, de trading o de otro tipo proporcionadas o respaldadas por TradingView. Más información en Condiciones de uso.
STWP | Mentor & Demand-Supply Specialist | Empowering traders through structured learning |
simpletradewithpatience.com
Community: chat.whatsapp.com/BEYz0tkqP0fJPBCWf59uel
wa.me/message/6IOPHGOXMGZ4N1
Educational Only
simpletradewithpatience.com
Community: chat.whatsapp.com/BEYz0tkqP0fJPBCWf59uel
wa.me/message/6IOPHGOXMGZ4N1
Educational Only
Exención de responsabilidad
La información y las publicaciones no constituyen, ni deben considerarse como asesoramiento o recomendaciones financieras, de inversión, de trading o de otro tipo proporcionadas o respaldadas por TradingView. Más información en Condiciones de uso.