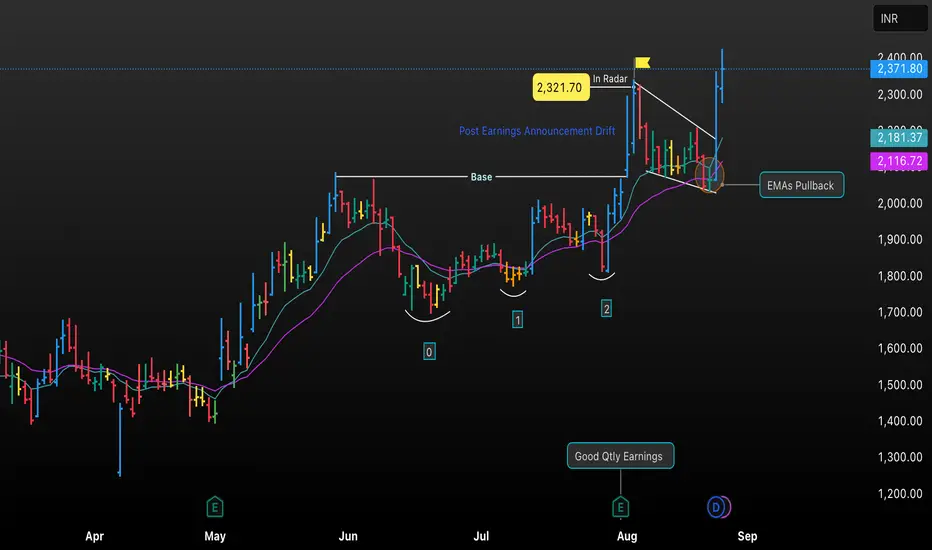
• This chart analyzes NETWEB’s price movement after a favorable quarterly earnings announcement, highlighting post-earnings drift, the formation of a trend base, and recent EMA pullback.
• Key annotations include buy signals, reaction levels, and actionable price zones to help identify optimal entry and exit opportunities for swing and positional trades.
• Clearly marked support and resistance, along with EMA overlays, provide a transparent ‘radar’ for traders to visualize how earnings and technical patterns interact.
Exención de responsabilidad
La información y las publicaciones que ofrecemos, no implican ni constituyen un asesoramiento financiero, ni de inversión, trading o cualquier otro tipo de consejo o recomendación emitida o respaldada por TradingView. Puede obtener información adicional en las Condiciones de uso.