📈 Chart Pattern: Bearish Harmonic (Possibly Bearish Bat or Gartley Variant)
⚠️ Price Structure Breakdown:
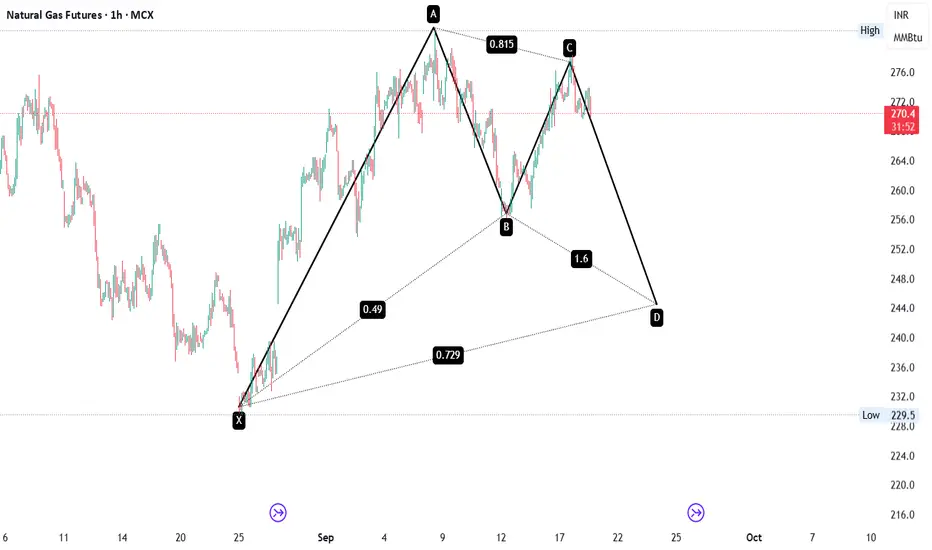
A clean XABCD Harmonic Pattern is visible on the 1H timeframe:
🔹 XA Leg: Sharp impulsive rally from ₹229 → ₹281
🔹 AB Leg: Pullback retraced 49% of XA
🔹 BC Leg: Strong recovery to 81.5% of AB
🔹 CD Projection: 1.6x extension of BC, projecting a potential D point near ₹244–248 zone
📌 Key Technical Highlights:
✅ Pattern in play: Bearish harmonic indicating upcoming correction phase
🧲 D target zone aligns with previous demand cluster from late August
🔄 Ideal reversal zone between ₹244–248 (Watch for price-action confirmation near D)
🎯 Possible Trade Setup (Anticipated Post Completion at Point D):
📉 Sell NG Futures near ₹244–248 (on reversal confirmation)
🎯 Targets: ₹234 → ₹229
🛑 SL: Above ₹251 (on closing basis)
🧠 Why This Matters:
Harmonic patterns like this, especially with clean Fibonacci alignment, often mark high-probability reversal zones. Combined with volume + divergence filters, this zone could provide a lucrative swing trade setup.
Exención de responsabilidad
La información y las publicaciones no pretenden ser, ni constituyen, asesoramiento o recomendaciones financieras, de inversión, de trading o de otro tipo proporcionadas o respaldadas por TradingView. Más información en Condiciones de uso.
Exención de responsabilidad
La información y las publicaciones no pretenden ser, ni constituyen, asesoramiento o recomendaciones financieras, de inversión, de trading o de otro tipo proporcionadas o respaldadas por TradingView. Más información en Condiciones de uso.