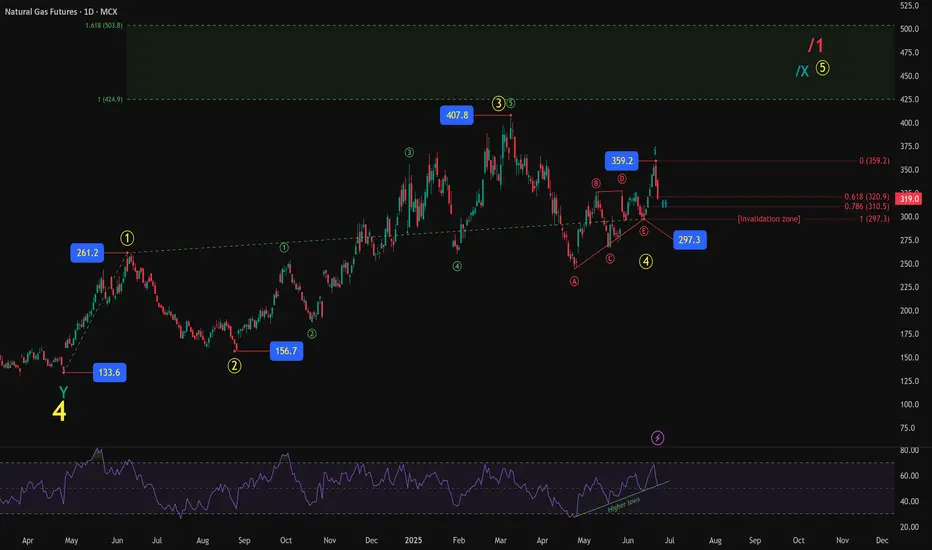
Natural Gas Futures (MCX) is showing an interesting Elliott Wave structure unfolding. After completing a corrective Y wave near 133.6, prices started a well-defined impulsive advance. The initial advance took shape as a 5-wave structure (yellow degree), completing wave 1 at 261.2, followed by a healthy correction into wave 2 at 156.7. The subsequent rally carved out another 5-wave pattern (green degree), pushing prices toward 407.8, marking a likely completion of wave 3.
The corrective wave 4 unfolded as a typical contracting triangle (ABCDE), finding support around 297.3. This triangle structure respected the Elliott guidelines quite well and indicates a potential setup for the next impulsive leg higher.
Post-triangle, the initial move up to 359.2 can be counted as wave i of the next larger impulse. The ongoing retracement has pulled back close to 61.8%–78.6% Fibonacci levels, a common zone for wave ii corrections. The RSI continues to print higher lows, supporting the underlying bullish sequence.
The invalidation zone is clearly marked around 297.3. As long as price remains above this level, the possibility of an ongoing bullish impulse remains valid, with eventual targets extending much higher toward the 1.618 projection zone near 503.
This remains a developing wave count, with structure still unfolding. Monitoring how price reacts around current levels will provide further clues whether the larger bullish sequence resumes or deeper correction emerges.
Disclaimer:
This analysis is for educational purposes only and does not constitute investment advice. Please do your own research (DYOR) before making any trading decisions.
WaveXplorer | Elliott Wave insights
📊 X profile: @veerappa89
📊 X profile: @veerappa89
Exención de responsabilidad
La información y las publicaciones no pretenden ser, ni constituyen, asesoramiento o recomendaciones financieras, de inversión, de trading o de otro tipo proporcionadas o respaldadas por TradingView. Más información en Condiciones de uso.