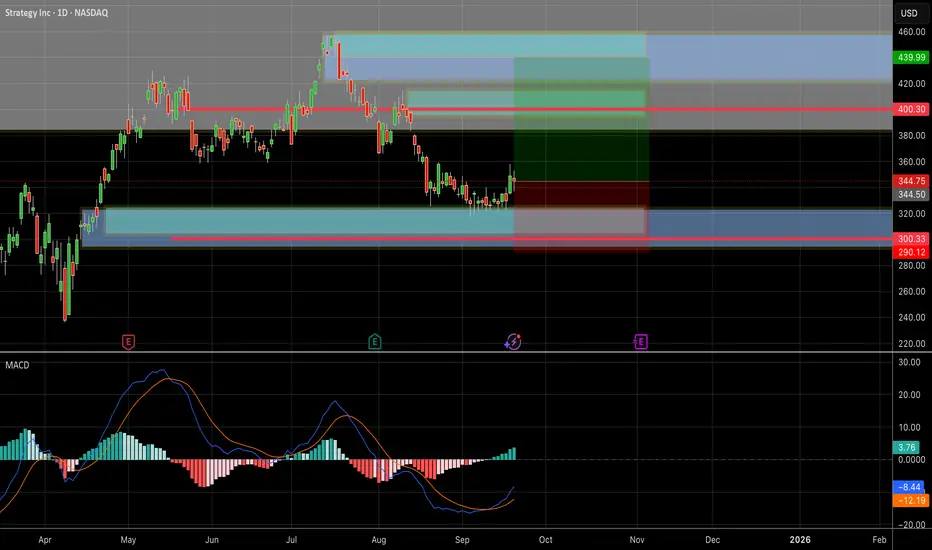
Technical Outlook:
• The stock is currently trading around $344 after a solid bounce from a key demand zone at $300 – $320.
• The MACD indicator shows a recent bullish crossover, with green histogram bars starting to form → signaling a potential continuation of upward momentum.
• On the daily chart, the first resistance zone is at $400 – $405, followed by an extended target at $440.
Trade Setup (Swing Idea):
• Entry Zone: $340 – $345.
• Stop Loss: Below $290 (a breakdown would invalidate the bullish setup).
• Targets:
• TP1: $400 (partial take-profit).
• TP2: $405.
• TP3: $440.
The Risk/Reward ratio (RRR) is attractive here (above 2:1).
Analysts’ View:
• Most analysts rate MSTR as Strong Buy / Buy.
• The 12-month price targets range between $530 – $600, with some optimistic projections going as high as $700.
• Key risk: MSTR’s performance is highly correlated with Bitcoin (BTC). Any strong BTC retracement could weigh heavily on the stock.
Conclusion:
MicroStrategy shows bullish technical signals after rebounding from strong support, supported by momentum indicators and positive analyst outlook.
Still, strict risk management is crucial, given the stock’s volatility and its dependence on Bitcoin’s price movements.
Exención de responsabilidad
La información y las publicaciones que ofrecemos, no implican ni constituyen un asesoramiento financiero, ni de inversión, trading o cualquier otro tipo de consejo o recomendación emitida o respaldada por TradingView. Puede obtener información adicional en las Condiciones de uso.