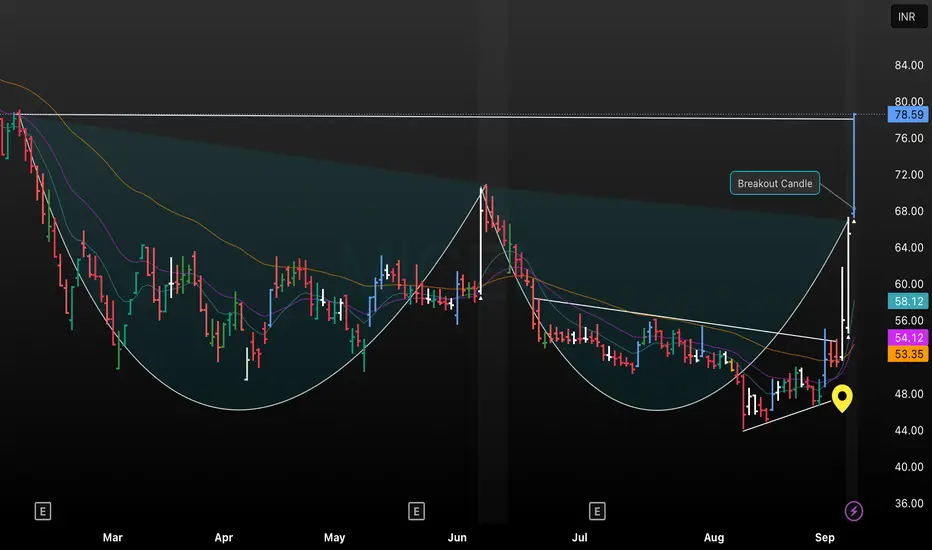
This chart shows the daily price action of MICEL, highlighting a classic cup and handle formation that developed over several months. The highlighted candle marks a strong breakout above the horizontal resistance near ₹78.59, confirming the pattern and signaling bullish momentum. Multiple moving averages are included for added trend analysis; the breakout volume and rapid price move suggest potential for further upside, making this setup significant for momentum traders.
Exención de responsabilidad
La información y las publicaciones que ofrecemos, no implican ni constituyen un asesoramiento financiero, ni de inversión, trading o cualquier otro tipo de consejo o recomendación emitida o respaldada por TradingView. Puede obtener información adicional en las Condiciones de uso.