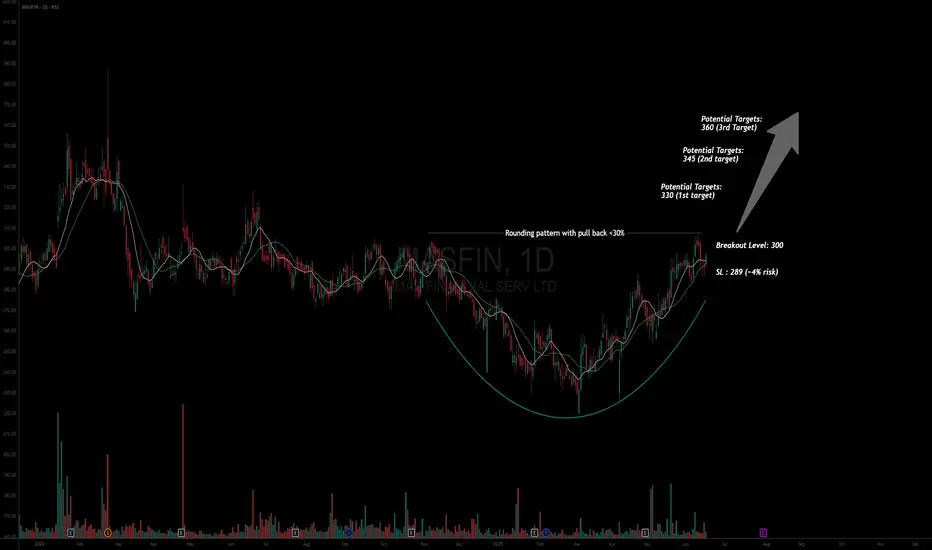
Asset: MAS Financial Services Ltd (MASFIN)
Breakout Level: 300
Potential Target: 330 (1st target) / 345 (2nd target) / 360 (3rd Target)
Stop Loss: 289 (~4% risk)
Timeframe: Short to Medium term
Risk to Reward ratio : 1:2.6 (conservative for first target)
Rationale:
Fundamentals -
Fundamentally decent stock with the following attributes:
* ROCE - 11.2%
* ROE - 14.1%
* Debt to Equity - 3.51 (This is acceptable considering Debt is any financial institutions working capital)
* Stock PE 17.3 / Industry PE - 25.3 || Stock PBV 2.05 / Industry PBV 1.86 - Company is slightly underpriced
* EPS / Revenue - Increasing over last 12 months
* ADR is 3.1%
Technical -
* Overall structure - Price has just finished forming a rounding pattern. The price is now surfing the 10/20 DMA and the 50/200 DMA are aligning as well. The slope of 200 DMA is hinting that revival has started and early entry is possible.
* Relative Strength is picking up and Momentum slope lines are positive.
* Multiple timeframe analysis - Price surfing the 10 WSMA and monthly structures are lining up as well.
* Volumes reduce on down days and volumes increase on up days which indicate more buying interest
Market analysis
* Accumulation has started increasing by FIIs, DIIs, Mutual Funds
* Promoter holding has remained same for last 3 quarters
* Retail holding is goind down
* Price predicted to go up by ~38%
* Financial sector has been doing good and expected to continue out performance
Cons
* ADR is low at 3.1% indicating the move can be gradual.
This analysis is for educational purposes only and should not be considered as financial advice. Trading and investing in financial markets involve significant risk, and past performance is not indicative of future results. You should conduct your own research and consult with a qualified financial advisor before making any trading or investment decisions. The author is not responsible for any financial losses or damages that may result from the use of this information.
Exención de responsabilidad
The information and publications are not meant to be, and do not constitute, financial, investment, trading, or other types of advice or recommendations supplied or endorsed by TradingView. Read more in the Terms of Use.
Exención de responsabilidad
The information and publications are not meant to be, and do not constitute, financial, investment, trading, or other types of advice or recommendations supplied or endorsed by TradingView. Read more in the Terms of Use.