Fibonacci is one of the important tool to predict and understand the retracement of the stock.
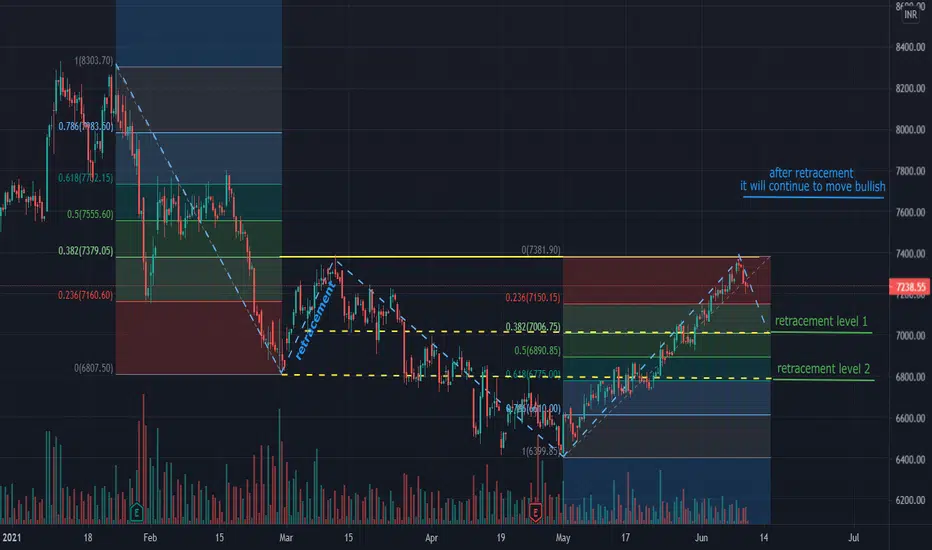
MARUTI SUZUKI was in down trend since mid of Feb started retracement on 26th of Feb around 8610 and retraced by 38.2% till 7372, which is also a price at the current date. after this retracement it continued the down trend.
A trend reversal is observed on 30th of April and stock moved bullish since then. Now, it has reached to the high of the symmetric level from past retracement (7372). It expected to retrace atleast by 38.2% or to max to the level of 61.8%.
pls keep an eye on it and pls comment your observations too.
Operación activa
approaching towards first retracement levelOperación activa
it took the retracement from level 2Operación cerrada: objetivo alcanzado
target reached. Power of FibonacciExención de responsabilidad
The information and publications are not meant to be, and do not constitute, financial, investment, trading, or other types of advice or recommendations supplied or endorsed by TradingView. Read more in the Terms of Use.
Exención de responsabilidad
The information and publications are not meant to be, and do not constitute, financial, investment, trading, or other types of advice or recommendations supplied or endorsed by TradingView. Read more in the Terms of Use.