Chainlink (LINK) – The Final Stage of a 5-Year Compression**
The chart is telling one very clear story:
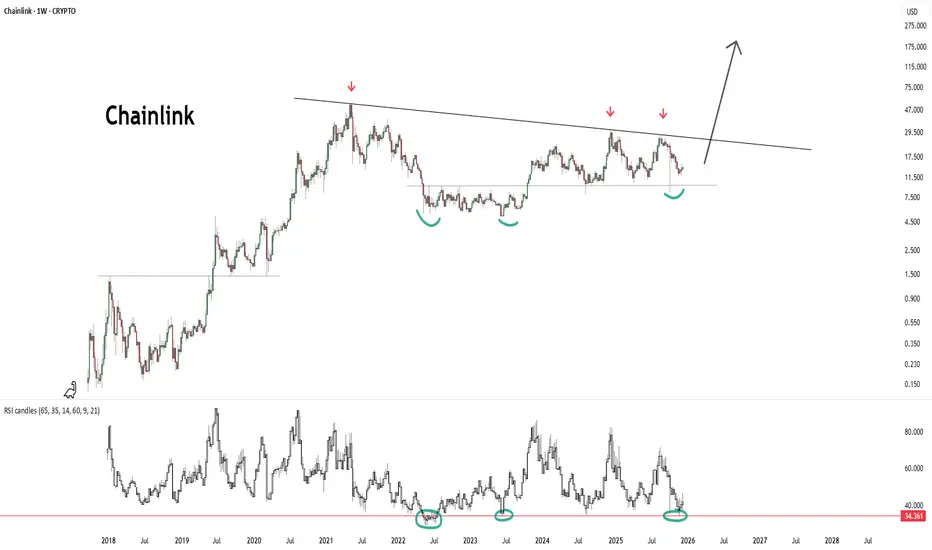
> **Chainlink is approaching the end of a 4-year descending macro trend while sitting on a 3-year accumulation floor.**
> The moment these two structures converge, a major regime shift usually follows.
**“The 5-Year Pressure Is About to Break.”**
---
🔹 **1) The 4-Year Descending Macro Trend (2021 → 2025)**
The red arrows mark the same long-term trendline connecting the major tops of:
* 2021
* 2022
* 2024
This line has acted as the **spine of the bear market**.
And LINK is now marching **back into this line for the next major test**.
A break here is not just a trend break.
It is a **market regime shift**.
---
🔹 **2) The 3-Year Horizontal Accumulation Floor**
The green curved bottoms highlight how:
* 2022
* 2023
* 2024
* and late 2025
have all produced **identical bottom structures** around the 12–13$ region.
This is:
**A large, asymmetric inverse H&S (iH&S) structure**
Ugly, uneven, but extremely powerful.
Key observations:
* Bottoms don’t break
* Selling is absorbed
* Volatility is compressing
* Strong structural demand refuses to give way
This is **large-scale accumulation**, not weakness.
---
🔹 **3) Weekly RSI – The Macro Cycle Floor**
The RSI bottom line around **34** has marked every major cyclical low since 2018:
* 2018 bear bottom
* 2020 crash
* 2022 bear bottom
* 2023 correction
* **And right now**
LINK’s **macro oscillator cycle is at bottom territory** — a region historically followed by multi-month expansions.
---
🔹 **4) Technically, the picture is this:**
* **A 4-year descending trendline above**
* **A 3-year accumulation zone below**
* **RSI sitting at cycle lows inside**
This is the type of setup that precedes massive impulsive waves.
---
⭐ **"Chainlink is coiled inside a high-timeframe expansion structure."**
When these structures break, they don’t produce small moves —
they produce **cycle expansions**.
---
🔹 **5) Fundamental Drivers – Why This Cycle Is Different for LINK**
Chainlink now sits at the center of crypto’s real infrastructure layer.
**1) CCIP (Cross-Chain Interoperability Protocol)**
Adopted by:
* BlackRock
* DTCC
* SWIFT
* Multiple banks and RWA platforms
2024–2025 marks the first time traditional finance begins using LINK’s infrastructure at scale.
**2) Oracle fee growth**
The rise of RWA (Real-World Assets) means:
* More data feeds
* More volume
* More fees
* More burn pressure on the token economy
Chainlink’s tokenomics finally enter a structurally bullish regime.
**3) Macro Altcoin Liquidity Expansion**
In every cycle, certain infrastructure tokens become early movers.
LINK is positioned to be one of them due to:
* Dominance in the oracle sector
* Institutional integrations
* Network effects
---
🧭 **6) Probable Scenario (Technical)**
**Bullish scenario (primary expectation):**
* Break above the 4-year trendline
* Weekly close above **18–20$**
→ 29–32$
→ 46$
→ **Macro target: 70–75$**
**Bearish scenario (lower probability):**
* Breakdown below 13$
→ liquidity sweep toward 9–10$
(Indicators currently reject this scenario)
Log MACD

---
LINK/BTC 1w

LINKBTC has been compressing inside a falling wedge for nearly 6 years — one of the longest and cleanest structures in the entire market.
Multi-cycle descending trendline overhead
Perfectly defended accumulation line below
Volatility squeezed to historical lows
Sellers exhausted
Breakout energy building
LINKUSD and LINKBTC both aligning for macro upside
This is not a short-term chart.
This is a cycle-level setup.
And setups like this usually end the same way:
“Compression → Breakout → Parabolic Repricing vs Bitcoin.”
LINKBTC has been “ignored” for years because LINK’s USD pair looked stable while BTC outperformed.
But structurally:
BTC strength pushed LINKBTC down
LINK never lost its demand trendline
A massive energy coil has formed
When BTC dominance stalls or rotates,
LINKBTC normally enters a full expansion cycle.
Historically:
LINKBTC expansions are violent
They outperform BTC by 2–4× in strong phases
This pattern is setting the stage for another one.
🎯 **Conclusion
**Chainlink is approaching the most important structural point since 2020.**
The alignment is extremely rare:
* RSI at cycle lows
* Price at a 3-year demand floor
* Approaching a 4-year macro trendline
* CCIP adoption accelerating
* RWA growth pulling LINK into real-world usage
This is not a normal chart.
This is a **macro cycle setup**.
And these setups usually play out like this:
> **“Trend breaks → FOMO awakens → Expansion begins.”**
The chart is telling one very clear story:
> **Chainlink is approaching the end of a 4-year descending macro trend while sitting on a 3-year accumulation floor.**
> The moment these two structures converge, a major regime shift usually follows.
**“The 5-Year Pressure Is About to Break.”**
---
🔹 **1) The 4-Year Descending Macro Trend (2021 → 2025)**
The red arrows mark the same long-term trendline connecting the major tops of:
* 2021
* 2022
* 2024
This line has acted as the **spine of the bear market**.
And LINK is now marching **back into this line for the next major test**.
A break here is not just a trend break.
It is a **market regime shift**.
---
🔹 **2) The 3-Year Horizontal Accumulation Floor**
The green curved bottoms highlight how:
* 2022
* 2023
* 2024
* and late 2025
have all produced **identical bottom structures** around the 12–13$ region.
This is:
**A large, asymmetric inverse H&S (iH&S) structure**
Ugly, uneven, but extremely powerful.
Key observations:
* Bottoms don’t break
* Selling is absorbed
* Volatility is compressing
* Strong structural demand refuses to give way
This is **large-scale accumulation**, not weakness.
---
🔹 **3) Weekly RSI – The Macro Cycle Floor**
The RSI bottom line around **34** has marked every major cyclical low since 2018:
* 2018 bear bottom
* 2020 crash
* 2022 bear bottom
* 2023 correction
* **And right now**
LINK’s **macro oscillator cycle is at bottom territory** — a region historically followed by multi-month expansions.
---
🔹 **4) Technically, the picture is this:**
* **A 4-year descending trendline above**
* **A 3-year accumulation zone below**
* **RSI sitting at cycle lows inside**
This is the type of setup that precedes massive impulsive waves.
---
⭐ **"Chainlink is coiled inside a high-timeframe expansion structure."**
When these structures break, they don’t produce small moves —
they produce **cycle expansions**.
---
🔹 **5) Fundamental Drivers – Why This Cycle Is Different for LINK**
Chainlink now sits at the center of crypto’s real infrastructure layer.
**1) CCIP (Cross-Chain Interoperability Protocol)**
Adopted by:
* BlackRock
* DTCC
* SWIFT
* Multiple banks and RWA platforms
2024–2025 marks the first time traditional finance begins using LINK’s infrastructure at scale.
**2) Oracle fee growth**
The rise of RWA (Real-World Assets) means:
* More data feeds
* More volume
* More fees
* More burn pressure on the token economy
Chainlink’s tokenomics finally enter a structurally bullish regime.
**3) Macro Altcoin Liquidity Expansion**
In every cycle, certain infrastructure tokens become early movers.
LINK is positioned to be one of them due to:
* Dominance in the oracle sector
* Institutional integrations
* Network effects
---
🧭 **6) Probable Scenario (Technical)**
**Bullish scenario (primary expectation):**
* Break above the 4-year trendline
* Weekly close above **18–20$**
→ 29–32$
→ 46$
→ **Macro target: 70–75$**
**Bearish scenario (lower probability):**
* Breakdown below 13$
→ liquidity sweep toward 9–10$
(Indicators currently reject this scenario)
Log MACD
---
LINK/BTC 1w
LINKBTC has been compressing inside a falling wedge for nearly 6 years — one of the longest and cleanest structures in the entire market.
Multi-cycle descending trendline overhead
Perfectly defended accumulation line below
Volatility squeezed to historical lows
Sellers exhausted
Breakout energy building
LINKUSD and LINKBTC both aligning for macro upside
This is not a short-term chart.
This is a cycle-level setup.
And setups like this usually end the same way:
“Compression → Breakout → Parabolic Repricing vs Bitcoin.”
LINKBTC has been “ignored” for years because LINK’s USD pair looked stable while BTC outperformed.
But structurally:
BTC strength pushed LINKBTC down
LINK never lost its demand trendline
A massive energy coil has formed
When BTC dominance stalls or rotates,
LINKBTC normally enters a full expansion cycle.
Historically:
LINKBTC expansions are violent
They outperform BTC by 2–4× in strong phases
This pattern is setting the stage for another one.
🎯 **Conclusion
**Chainlink is approaching the most important structural point since 2020.**
The alignment is extremely rare:
* RSI at cycle lows
* Price at a 3-year demand floor
* Approaching a 4-year macro trendline
* CCIP adoption accelerating
* RWA growth pulling LINK into real-world usage
This is not a normal chart.
This is a **macro cycle setup**.
And these setups usually play out like this:
> **“Trend breaks → FOMO awakens → Expansion begins.”**
Exención de responsabilidad
La información y las publicaciones no constituyen, ni deben considerarse como asesoramiento o recomendaciones financieras, de inversión, de trading o de otro tipo proporcionadas o respaldadas por TradingView. Más información en Condiciones de uso.
Exención de responsabilidad
La información y las publicaciones no constituyen, ni deben considerarse como asesoramiento o recomendaciones financieras, de inversión, de trading o de otro tipo proporcionadas o respaldadas por TradingView. Más información en Condiciones de uso.