Technical Analysis
✅ 1. Price Structure: Higher Highs, Higher Lows
📊 2. Multi-Year Base Breakout Setup
📈 3. Relative Strength (RS) vs Nifty
📉 4. Moving Averages: Strong Alignment
🔊 5. Volume Analysis
🧠 Summary and Trade Plan
▶️ Bullish Case:
⛔ Bearish Risk:
🎯 Entry Watch:
🧭 Final Thoughts
✅ 1. Price Structure: Higher Highs, Higher Lows
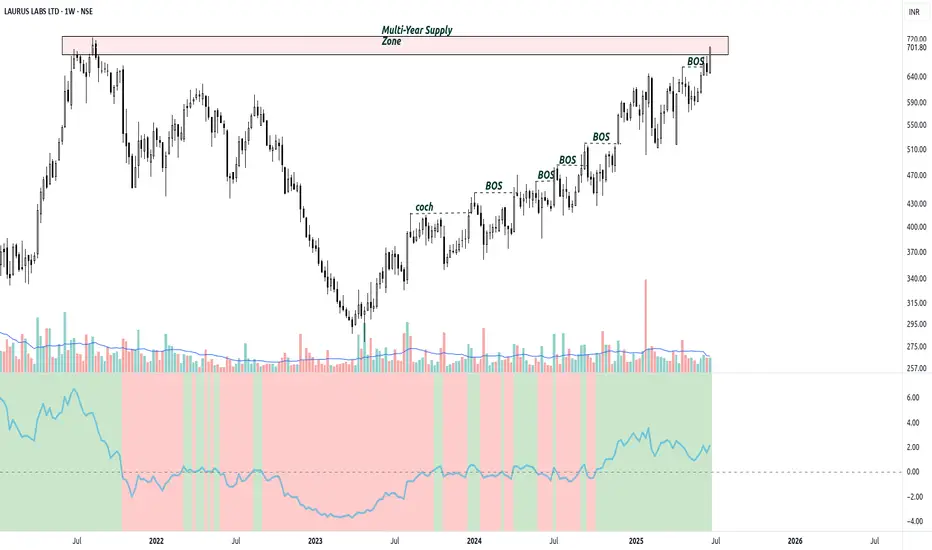
- The chart shows strong base-building over nearly 2 years following the explosive rally in 2020.
- Price formed a consolidation zone between ₹430–₹640, absorbing previous supply.
- Recent candles show tight price action and multiple Break of Structure (BOS) events — a classic signature of institutional accumulation.
- It is now approaching the all-time high zone (~₹720), acting as a key breakout level.
📊 2. Multi-Year Base Breakout Setup
- The current price action forms an ascending base, which often precedes explosive continuation in trending stocks.
- The price has moved up in tight bands with shallow corrections, reflecting volatility contraction — another bullish pattern.
- If price decisively breaks above ₹720 with volume, it could trigger a long-term uptrend continuation.
📈 3. Relative Strength (RS) vs Nifty
- The RS line has finally turned positive after a prolonged underperformance (2022–2023).
- Sustained RS strength on a weekly chart signals potential leadership behavior.
- The stock is now outperforming the benchmark, which is a critical filter in breakout selection.
📉 4. Moving Averages: Strong Alignment
- All major EMAs (20, 50, 100, 200 weekly) are now curved upward, showing a healthy trending environment.
- Price is comfortably trading above all EMAs, acting as dynamic support and confirming trend strength.
- 50-week EMA recently crossed above the 200-week EMA — a bullish long-term signal (Golden Cross on weekly).
🔊 5. Volume Analysis
- Volume is slightly muted but stable and consistent, indicating quiet accumulation.
- A breakout candle with a volume surge above the historical average would be ideal confirmation.
- The lack of wide-range down bars suggests distribution is absent.
🧠 Summary and Trade Plan
▶️ Bullish Case:
- Break and close above ₹720 on strong volume can activate a long-term trend continuation.
- Potential for a measured move of ~₹200–₹250, taking the stock toward ₹900–₹950 over time, if momentum sustains.
⛔ Bearish Risk:
- A rejection from ₹720 without follow-through, especially with increasing volume, may result in range re-entry.
- Invalidated if stock closes below ₹630–640 on the weekly chart.
🎯 Entry Watch:
- Ideal entry: Breakout + retest of ₹720 with narrowing candles.
- Aggressive entry: Around CMP with stop-loss below ₹630 and trail the stop as it trends.
🧭 Final Thoughts
- Laurus Labs is showing a mature base with breakout-ready structure. The trend strength, relative performance, and BOS stack-up make it one of the cleaner charts among mid-cap pharma names.
- All eyes should be on price action and volume near the ₹720 zone — this is where smart money often tips its hand.
Exención de responsabilidad
La información y las publicaciones que ofrecemos, no implican ni constituyen un asesoramiento financiero, ni de inversión, trading o cualquier otro tipo de consejo o recomendación emitida o respaldada por TradingView. Puede obtener información adicional en las Condiciones de uso.